What The Pools Know
Where the yield is, where the risk is hiding, and which pools most depositors haven't found.

Disclaimer
This report is made in collaboration with Kamino and is therefore sponsored. All editorial decisions, opinions, and conclusions expressed are entirely those of our own and remain independent of any external influence.
Key Points
- Combined RWA market TVL recently hit $1.23 billion, an all-time high — PRIME alone at $608.97 million, growing 15.5% over the past 30 days without a single incentive emission.
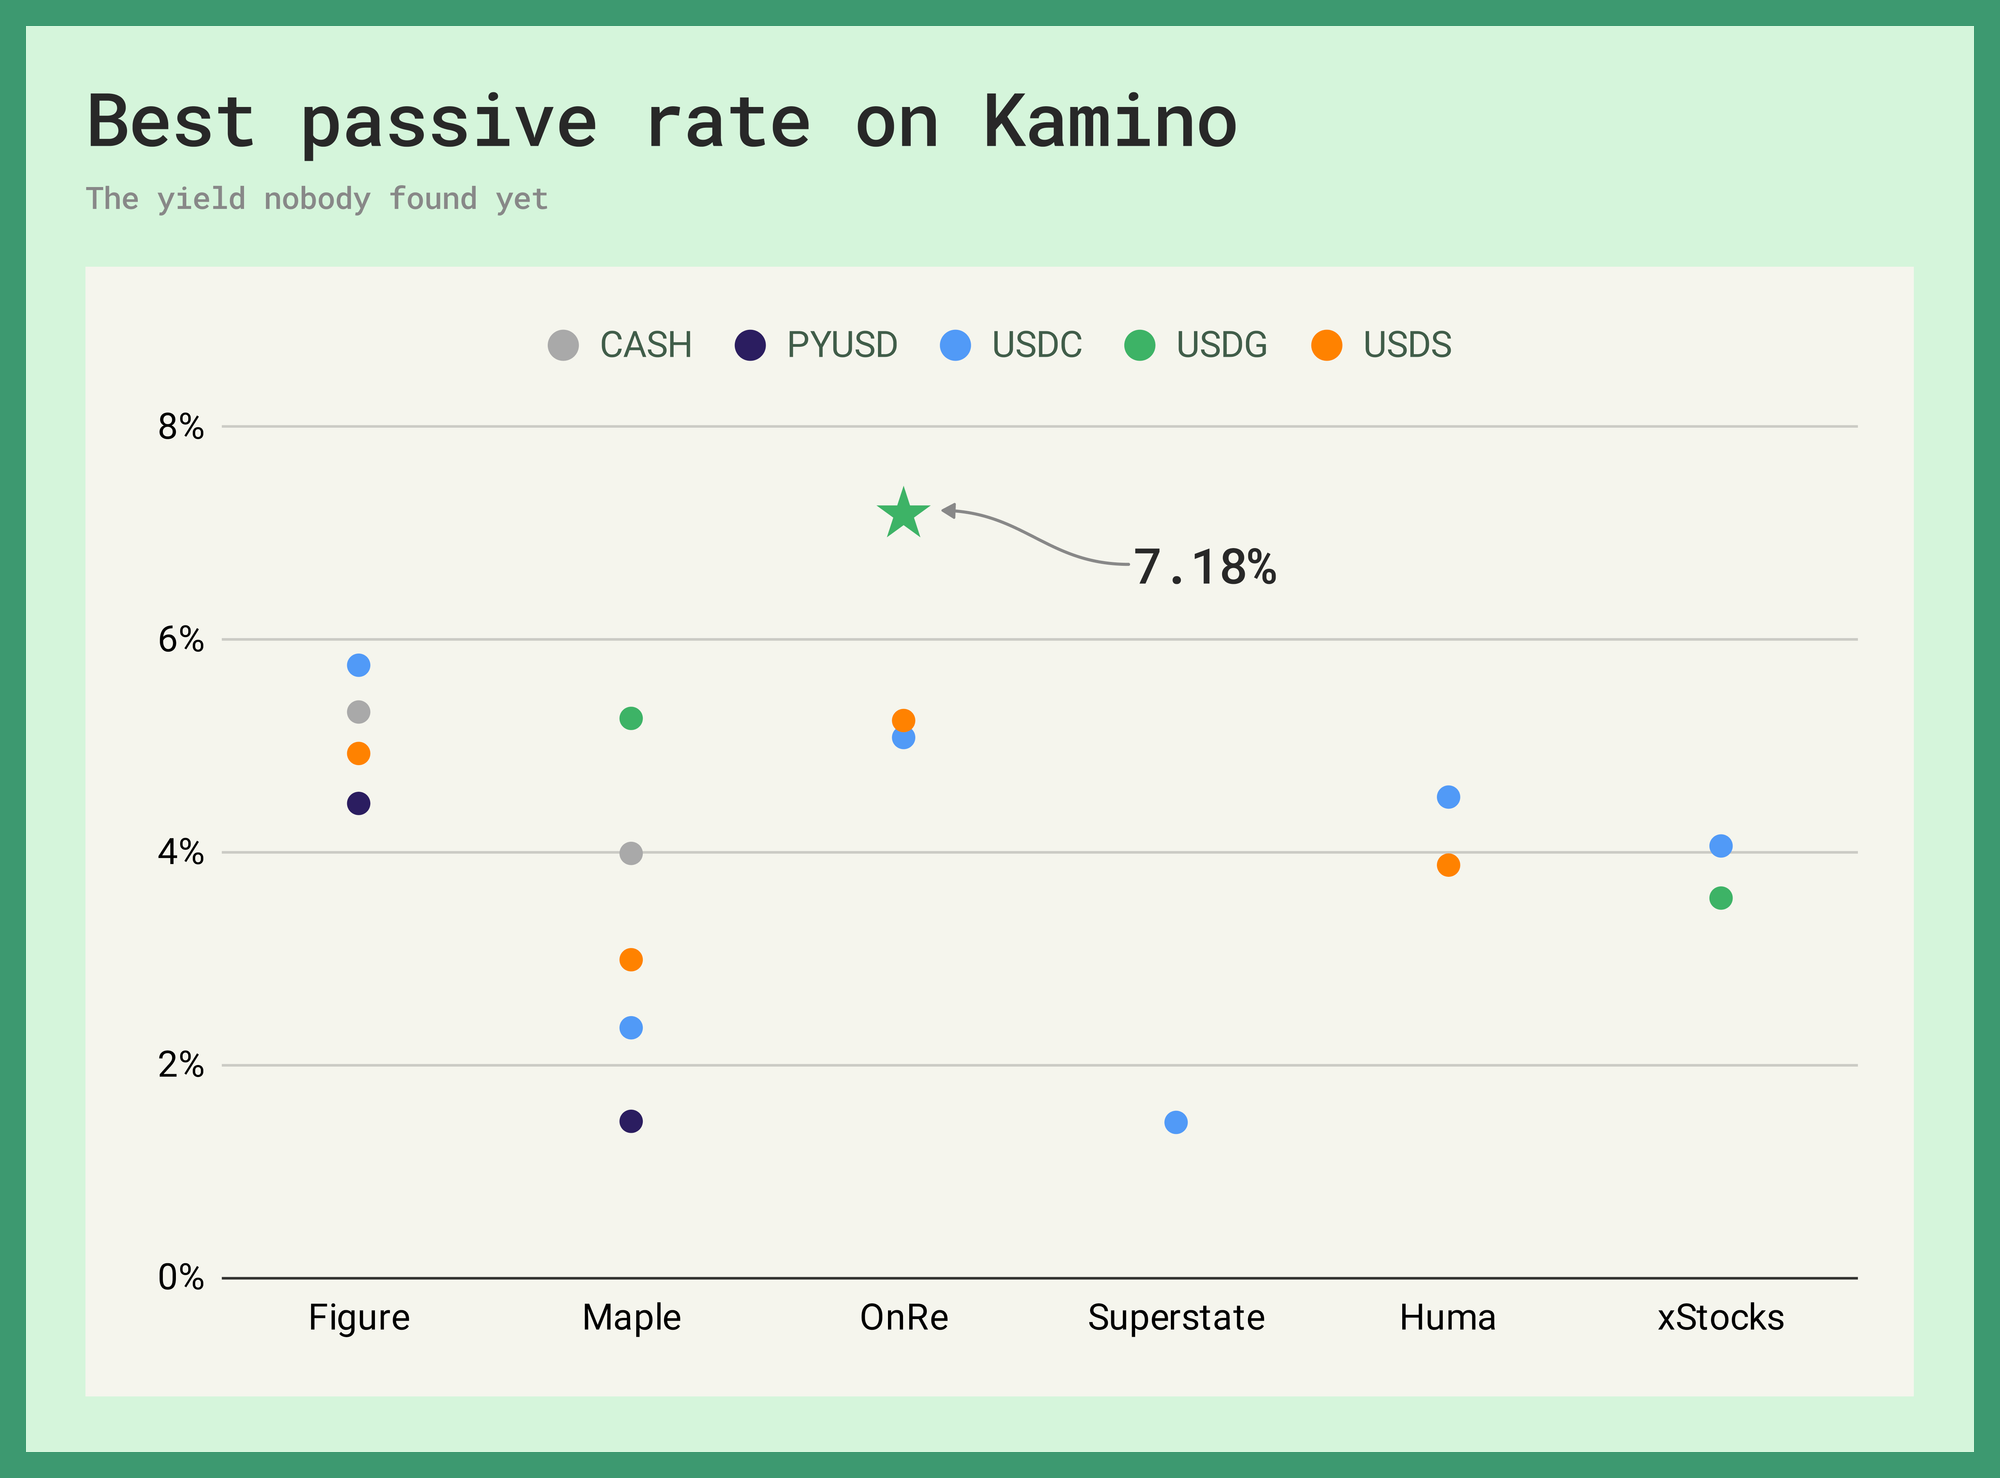
- OnRe's USDG pool is offering 7.18% supply APY at 93.34% utilization — the best passive lending rate across all five markets right now.
- PRIME borrow pools are not interchangeable — USDC is 93.78% utilized, CASH at 87.96%. PYUSD has the most headroom at 78.26% and comparable rates. At 5.66x average leverage, picking the wrong pool costs 50–100bps.
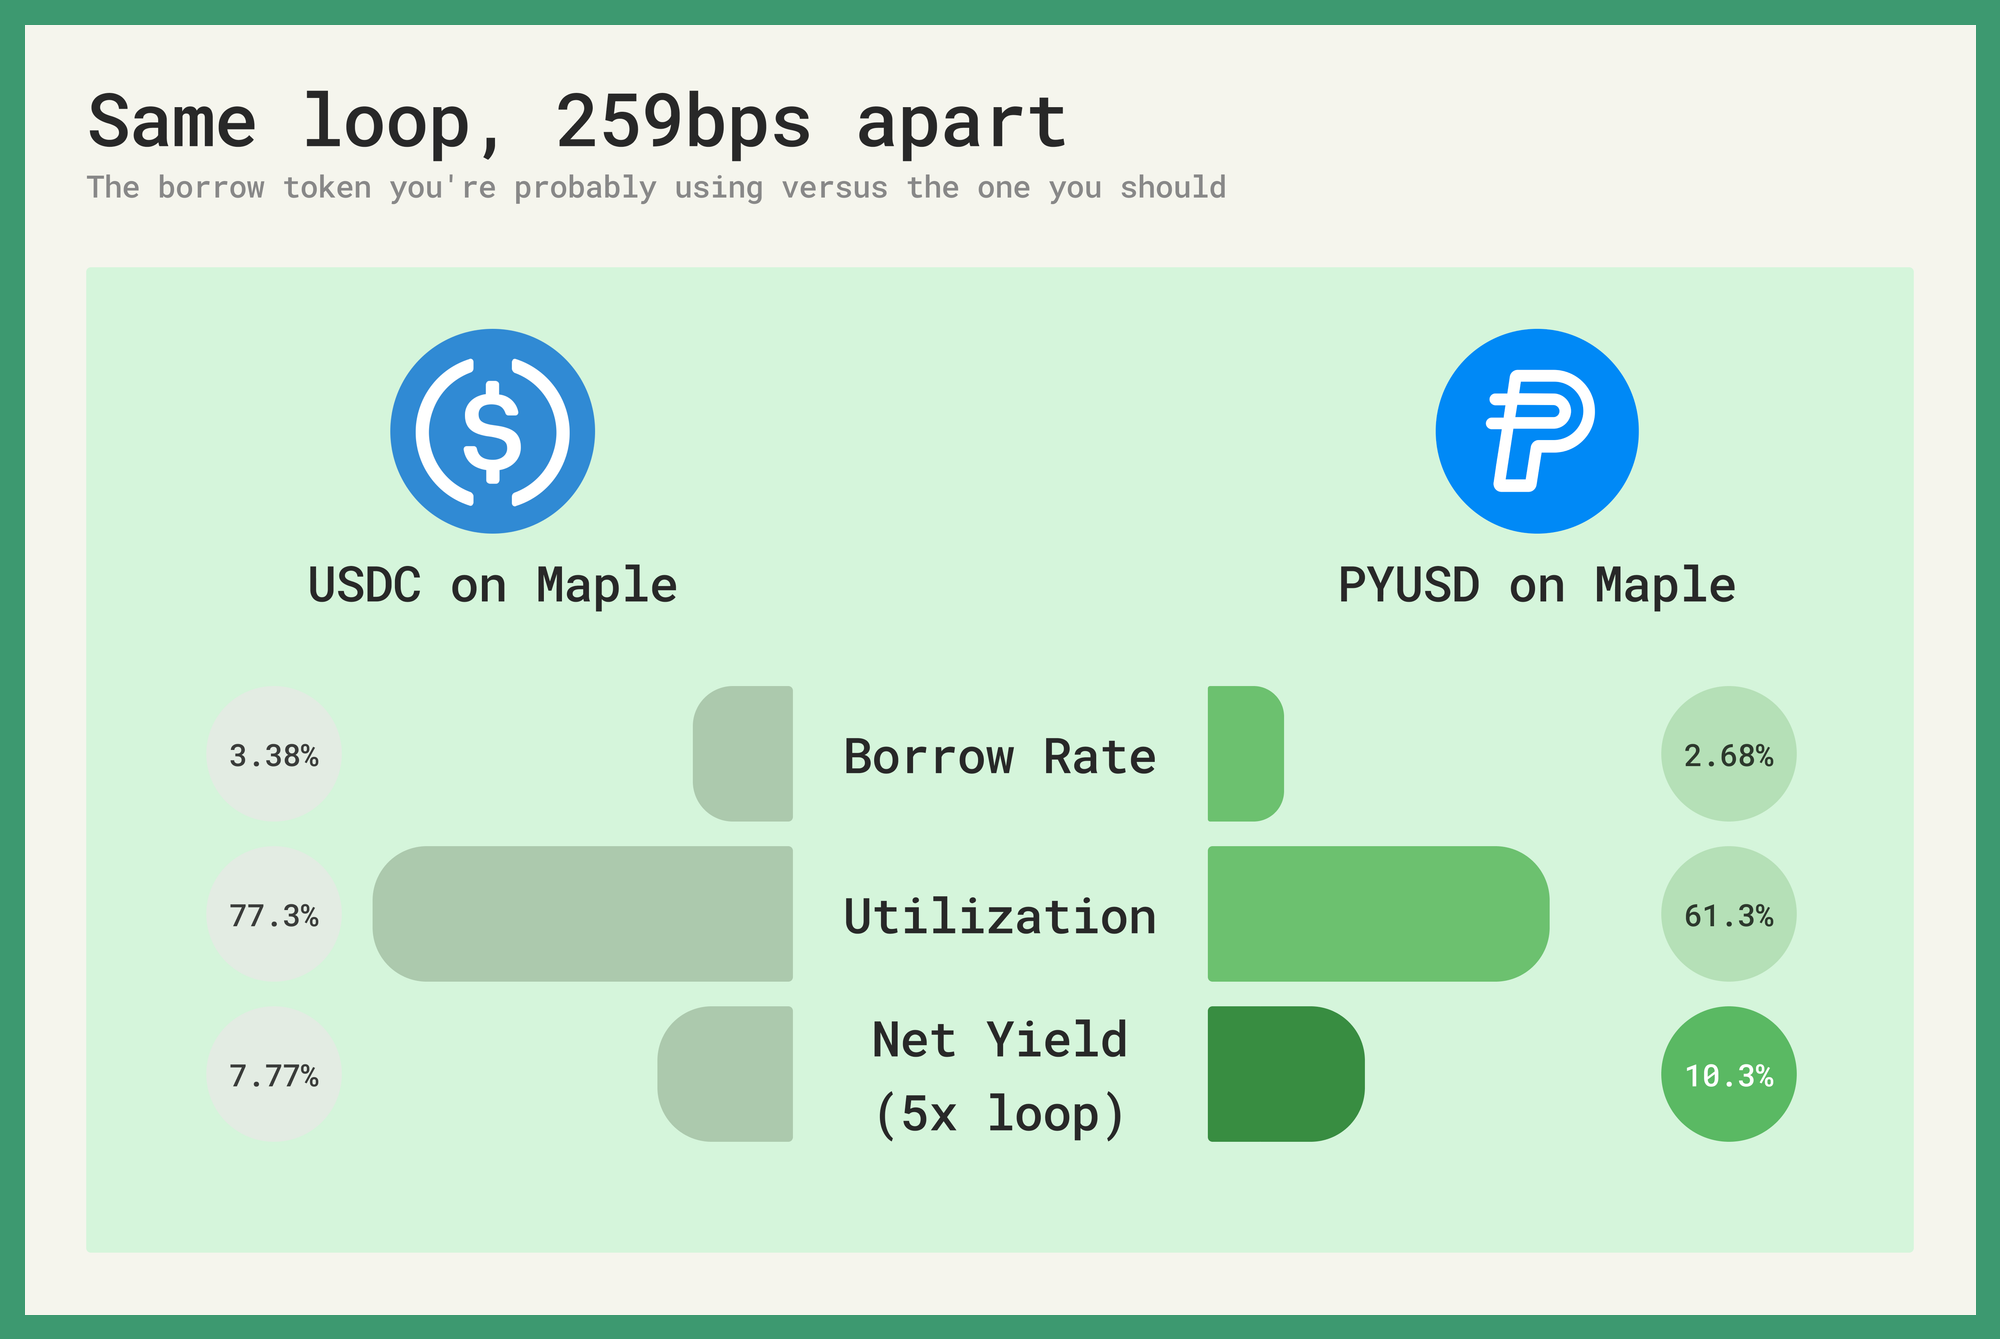
- The Maple PYUSD loop returns 259bps more than USDC at the same leverage — $130.58 million borrowed at 2.68% vs $11.45 million at 3.38%. At 5x: 10.36% net yield on PYUSD, 7.77% on USDC.
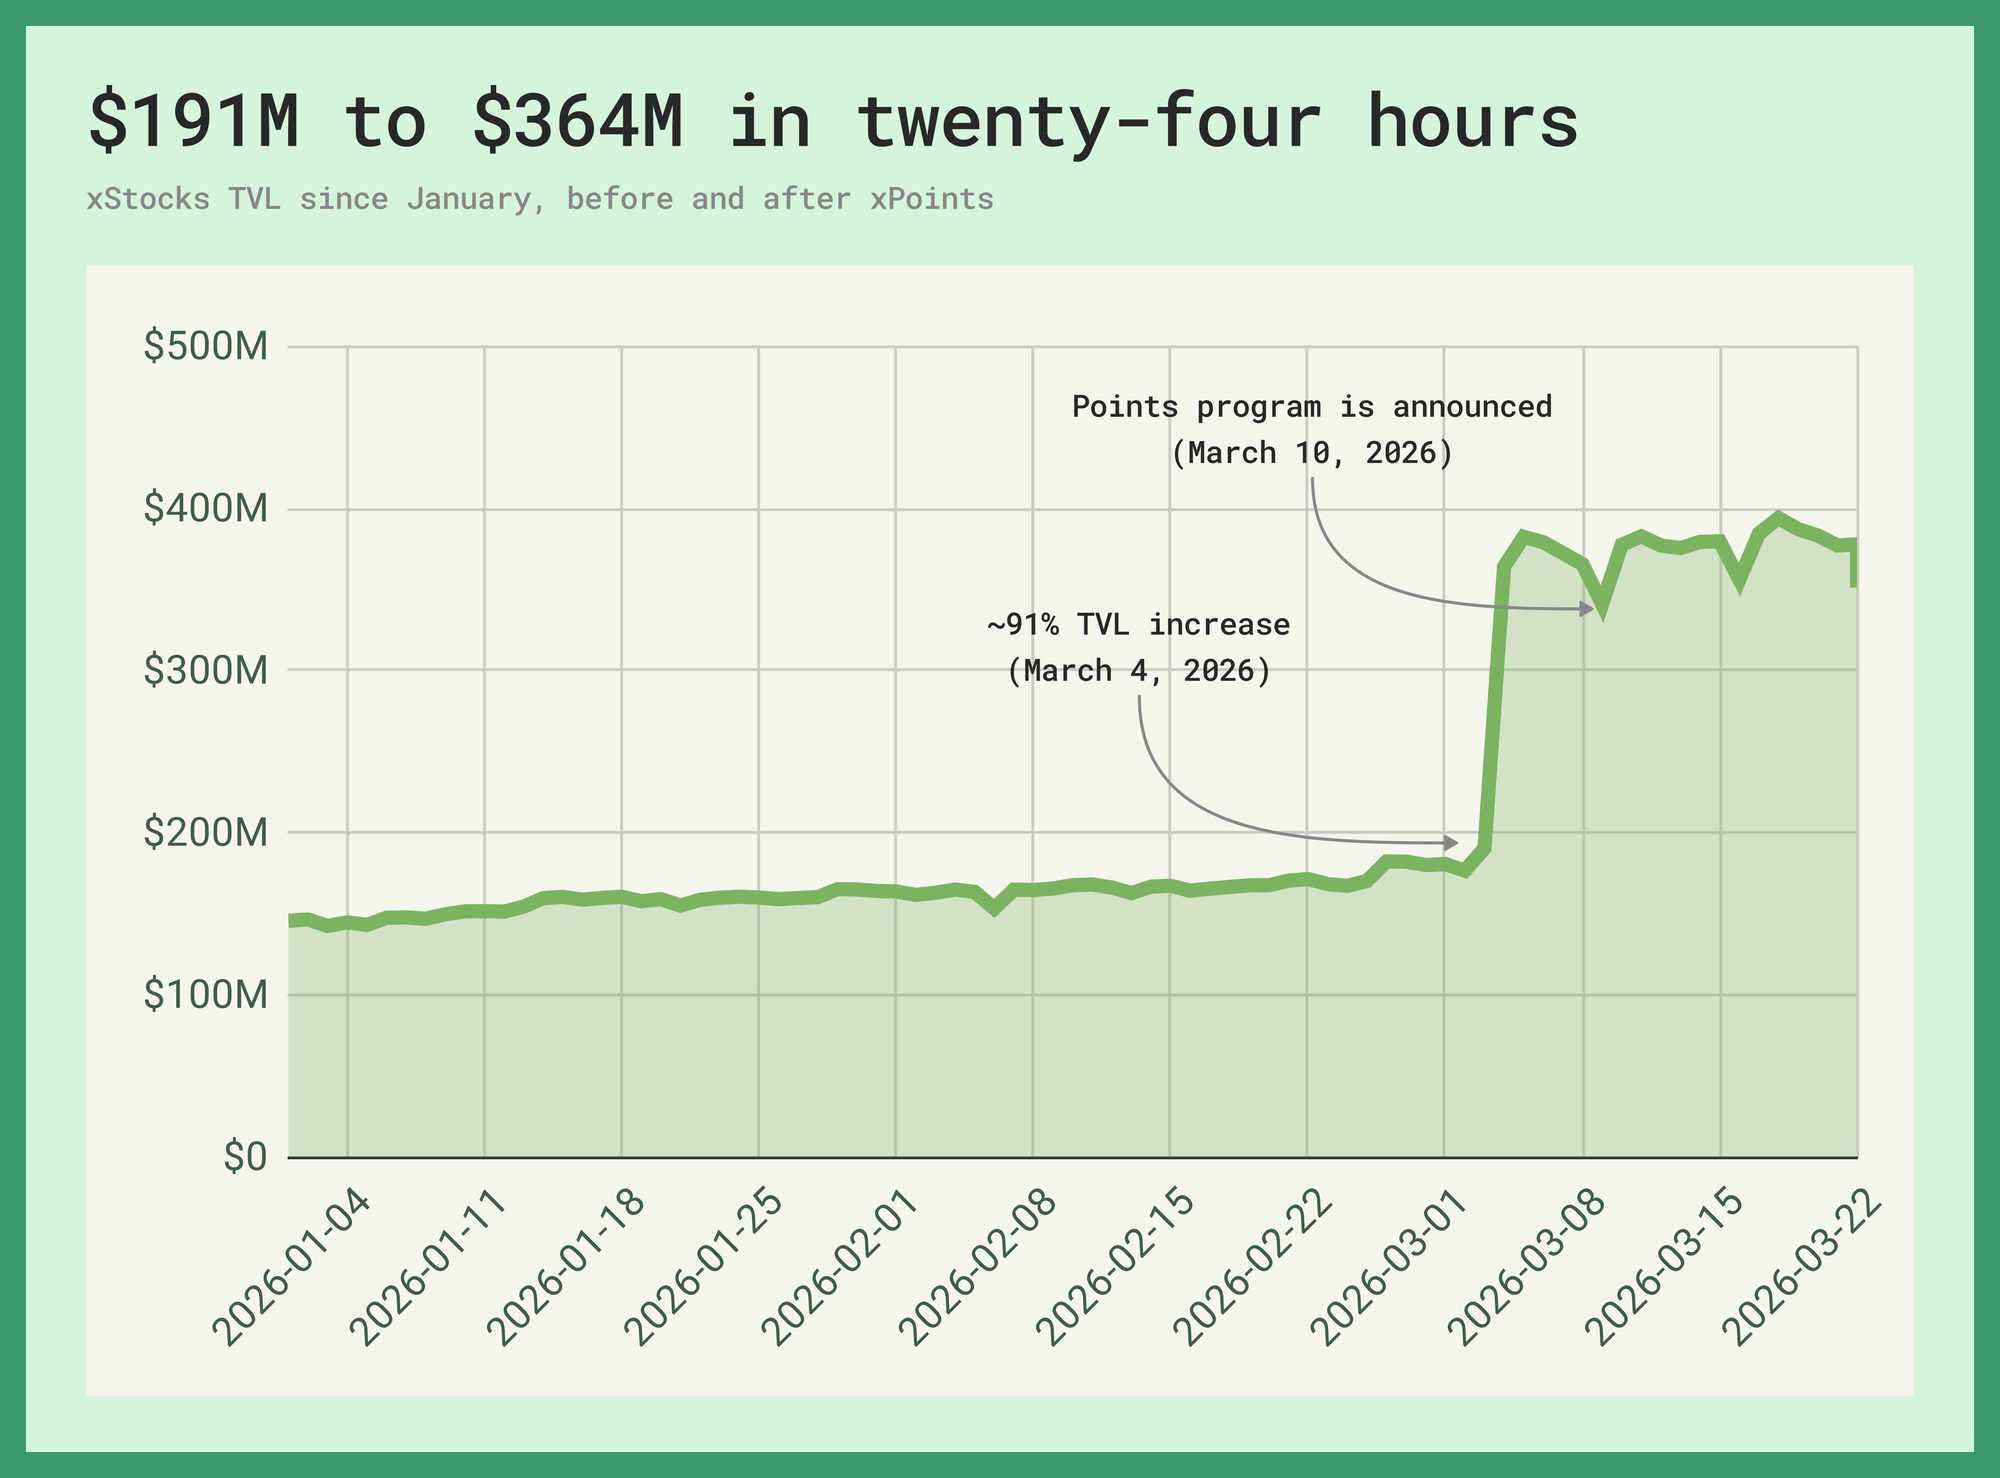
- xStocks protocol TVL doubled overnight as liquidity was seeded ahead of Kraken perps, xChange launch, and xPoints — the Kamino lending market sits at $25.08 million with 5317 wallets. USDC supply pays 5.38%; those borrowing against equity earn up to 1.96% in incentives.
Regime Change
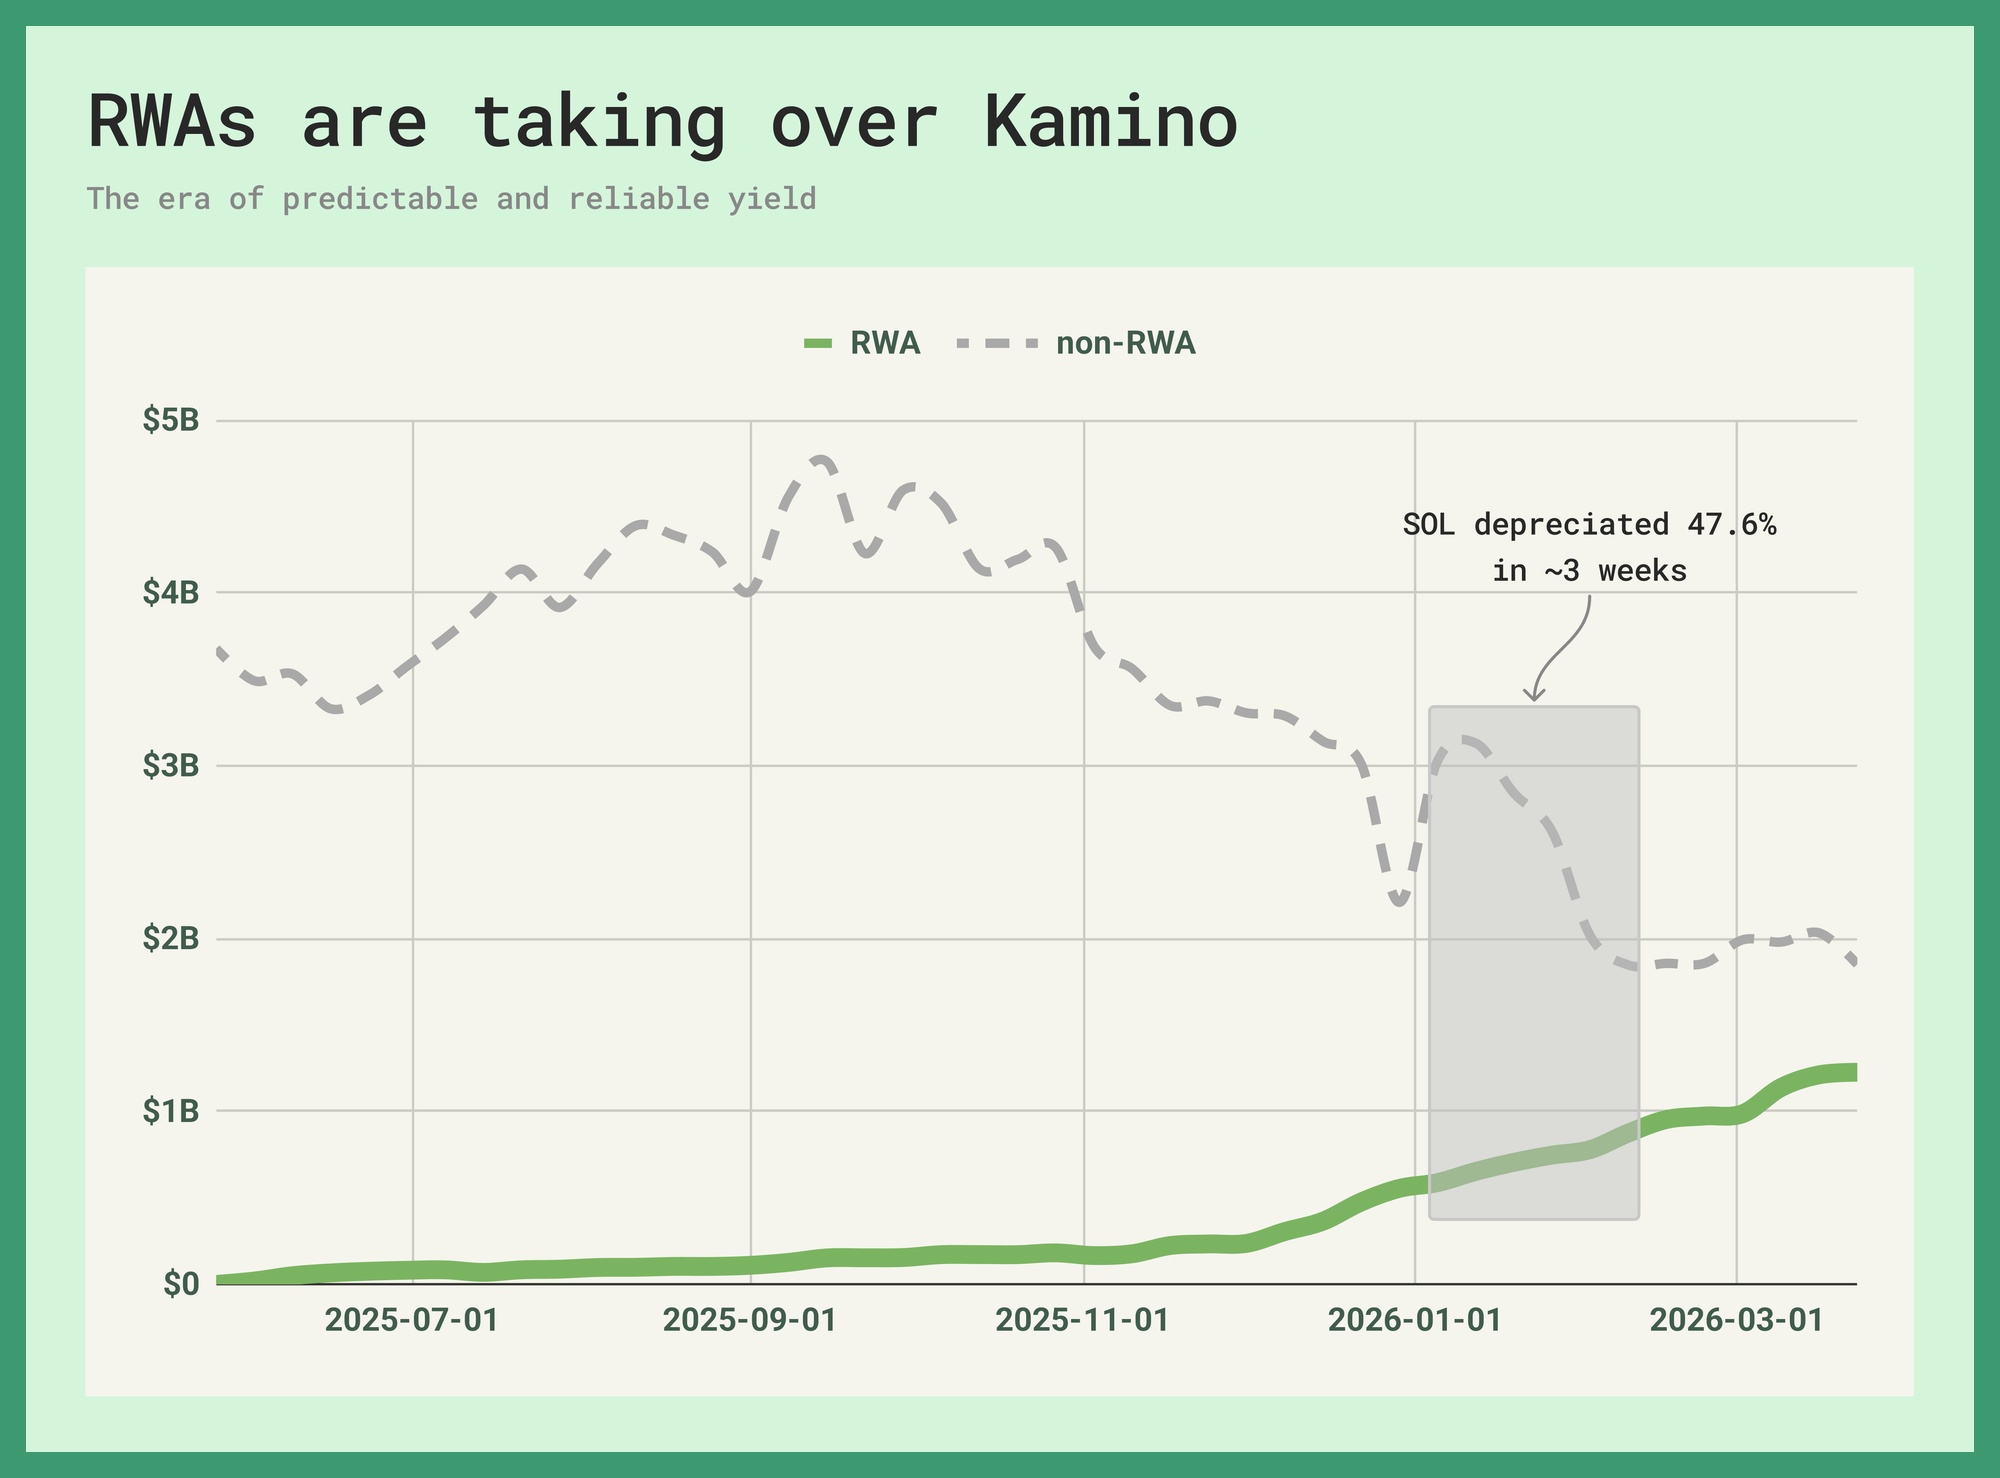
Tokenized real-world assets such as private credit, government securities, commodities, reinsurance capital and equity, crossed $20 billion in total value by the end of last year. These figures have since increased by another 25% in less than six months. The growth has been relentless and, unlike most things in this industry, almost entirely decoupled from price.
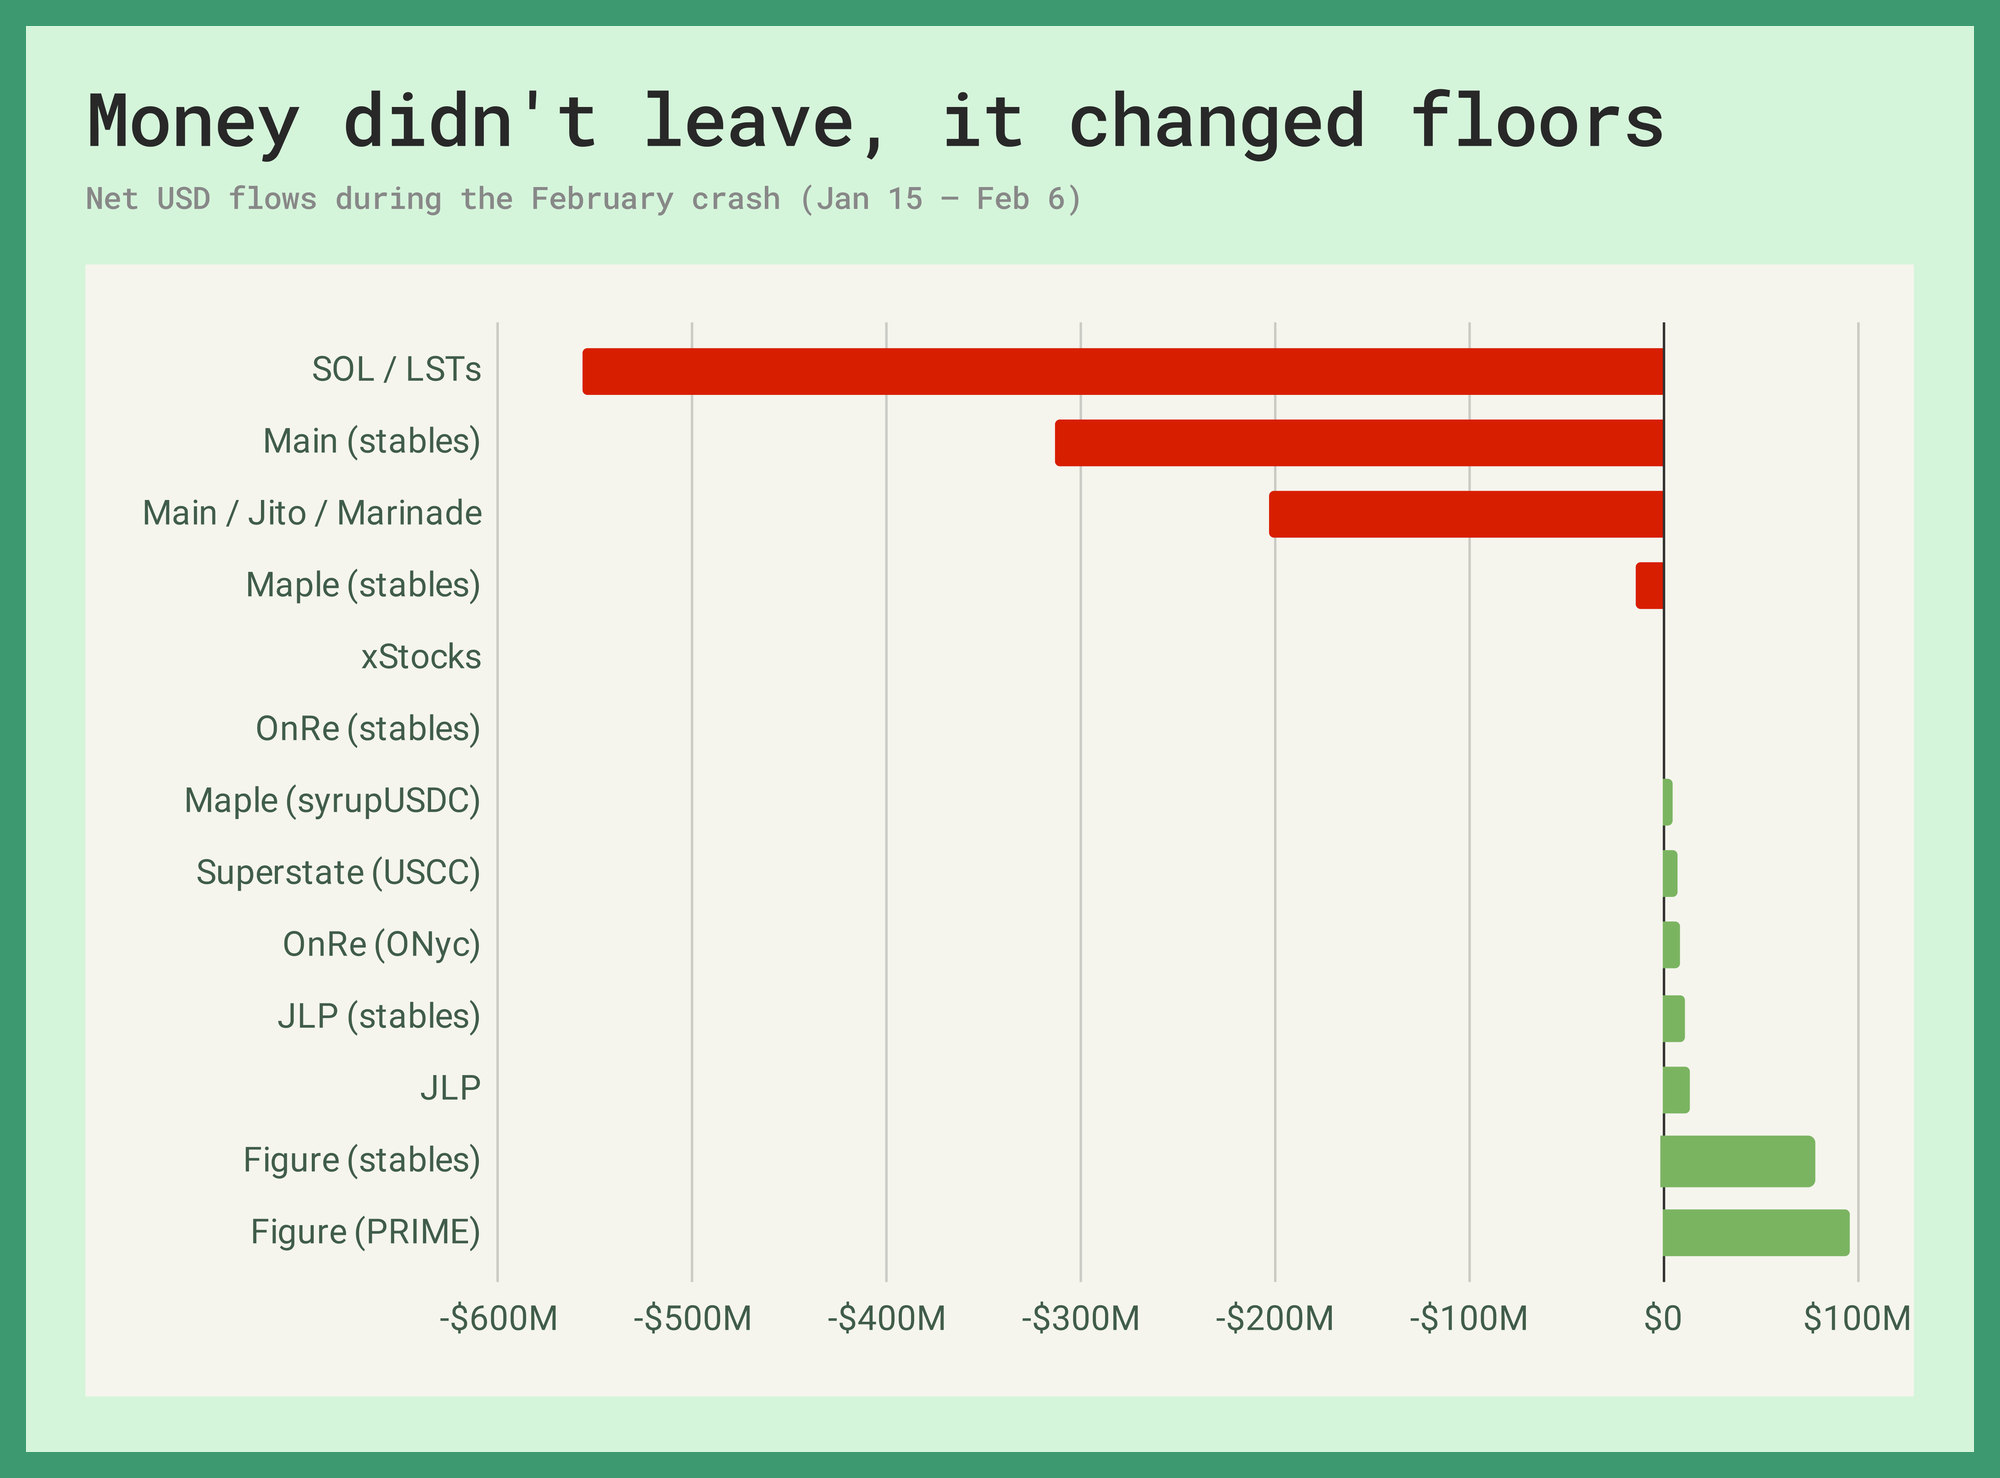
When SOL bled ~47.6% in the span of three weeks between January 15 and February 6, the main market lost roughly $971 million in dollar-denominated value with the native asset and its liquid staking derivatives taking the biggest hit. Even the largest stablecoin pools contracted, with $214 million in PYUSD and $105 million in USDC disappearing. During this period, RWA markets absorbed $173 million in net new deposits. PRIME alone took in $96 million of collateral and $89 million in USDC supply. The OnRe market grew 38% and Superstate 10x'd off a small base.
Stablecoins (38.3%) and real-world assets (18.9%) now cumulatively account for nearly 58% of total protocol liquidity, surpassing SOL and LSTs as the dominant asset class for the first time in the protocol's history. With the successful introduction of syrupUSDC in June, 2025 and PRIME in December, the composition of the platform started to change towards a more price agnostic regime.
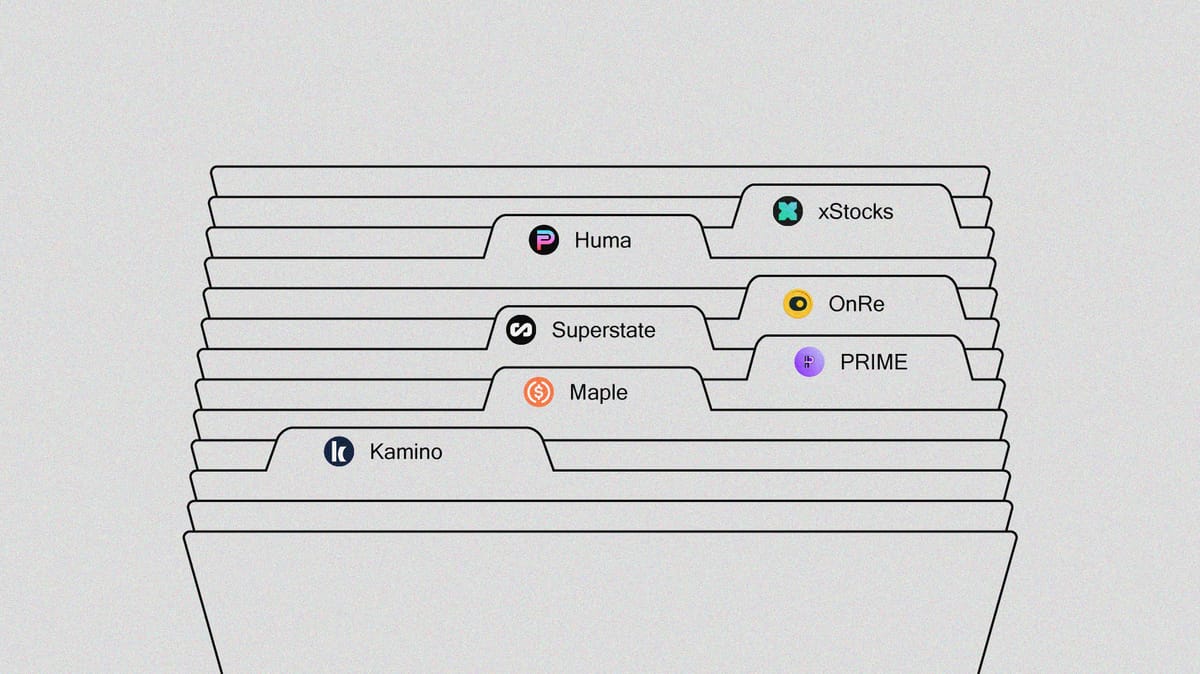
The growth narrative writes itself. The position-level data we pulled from the Kamino SDK across all five markets does not. Utilization gaps, wallet distributions, borrow rate spreads, concentration risk. Most of it is actionable.
Running Out of Room
PRIME recently crossed $623M in deposits, reaching a new all-time high 107 days after its launch. The underlying product hasn't changed, depositors earn 7.5 to 8% APY from HELOC borrower interest, with Multiply loops amplifying that through stablecoin leverage.
The variable that determines whether a loop is worth opening right now is utilization on the borrow side. PRIME's four borrow pools are not interchangeable.
USDC, the pool most depositors reach for first, is 93.78% utilized. CASH is at 87.96%. At those levels, rates are at their most expensive and most sensitive to incremental demand. PYUSD sits at a slightly less crowded 78.26%, with more room before utilization pressure compounds. At the average 5.66x leverage ratio across active PRIME Multiply positions, the spread between pools is roughly 50–100bps. Narrow on paper, meaningful at size.
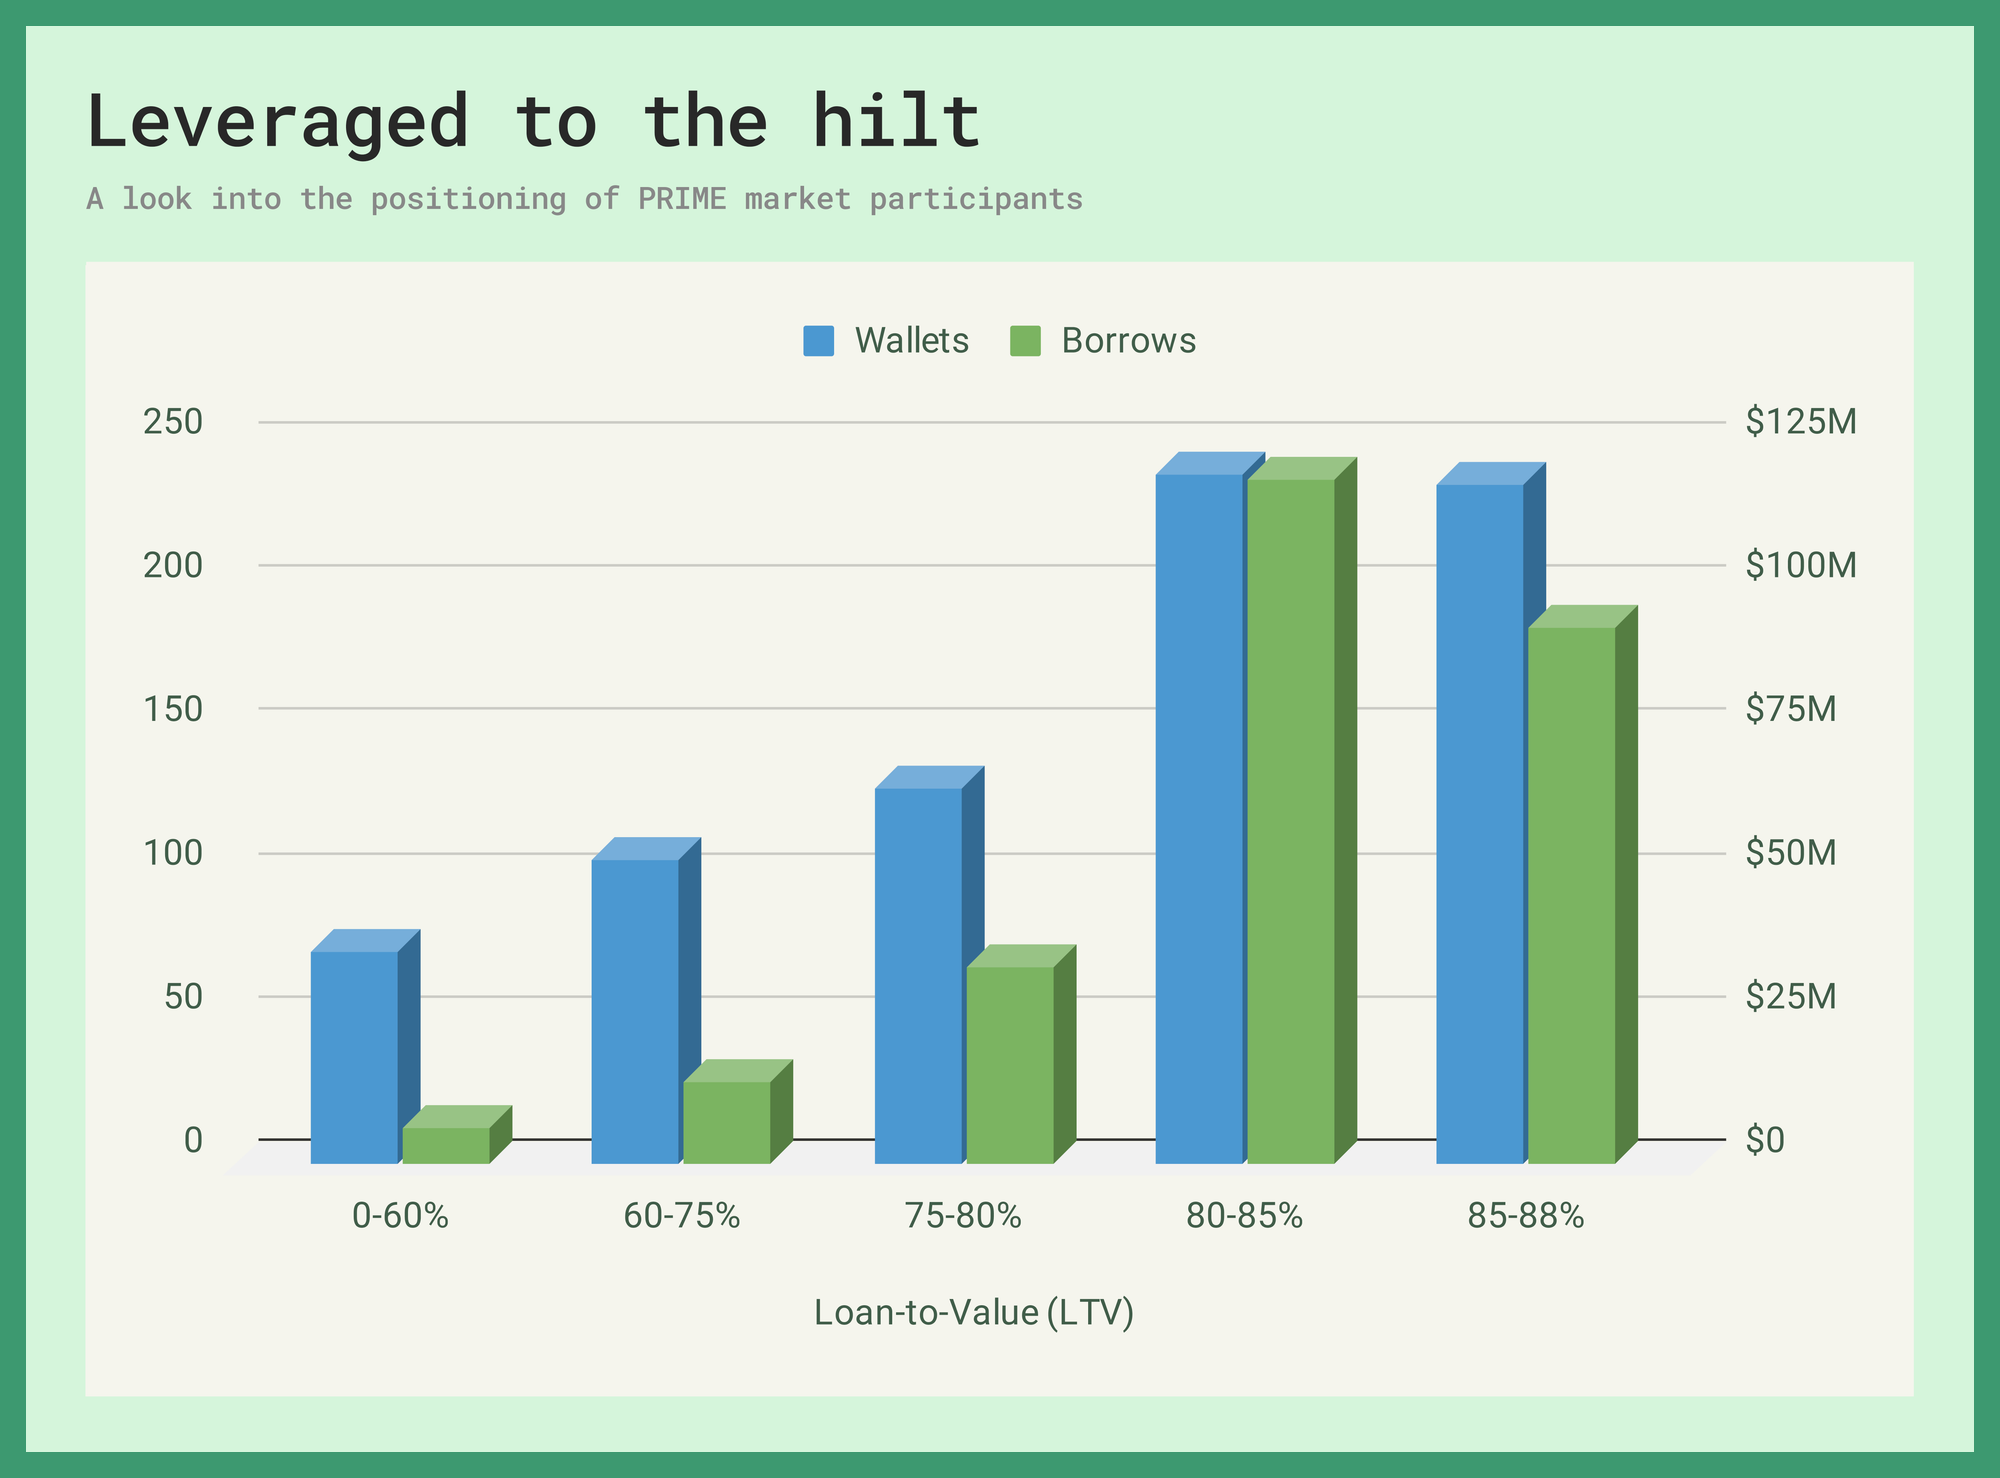
Among the market's 3488 unique wallet base, about a quarter are actively borrowing. The median borrower loan-to-value ratio is 82.3% against a maximum of 88%.
The intuitive assumption, that interest accrual slowly erodes the buffer between current LTV and liquidation is wrong at current rates. We backtested PRIME Multiply positions at 5.66, 6, 7, 8, and 8.33 leverage across all available borrow tokens over 97 days. In every combination, LTV improved. At 8.33x, the average position drifted down to 87.61%, generating 39bps of room from nothing. At 7x, the buffer widened by 28–32bps regardless of the borrow token.
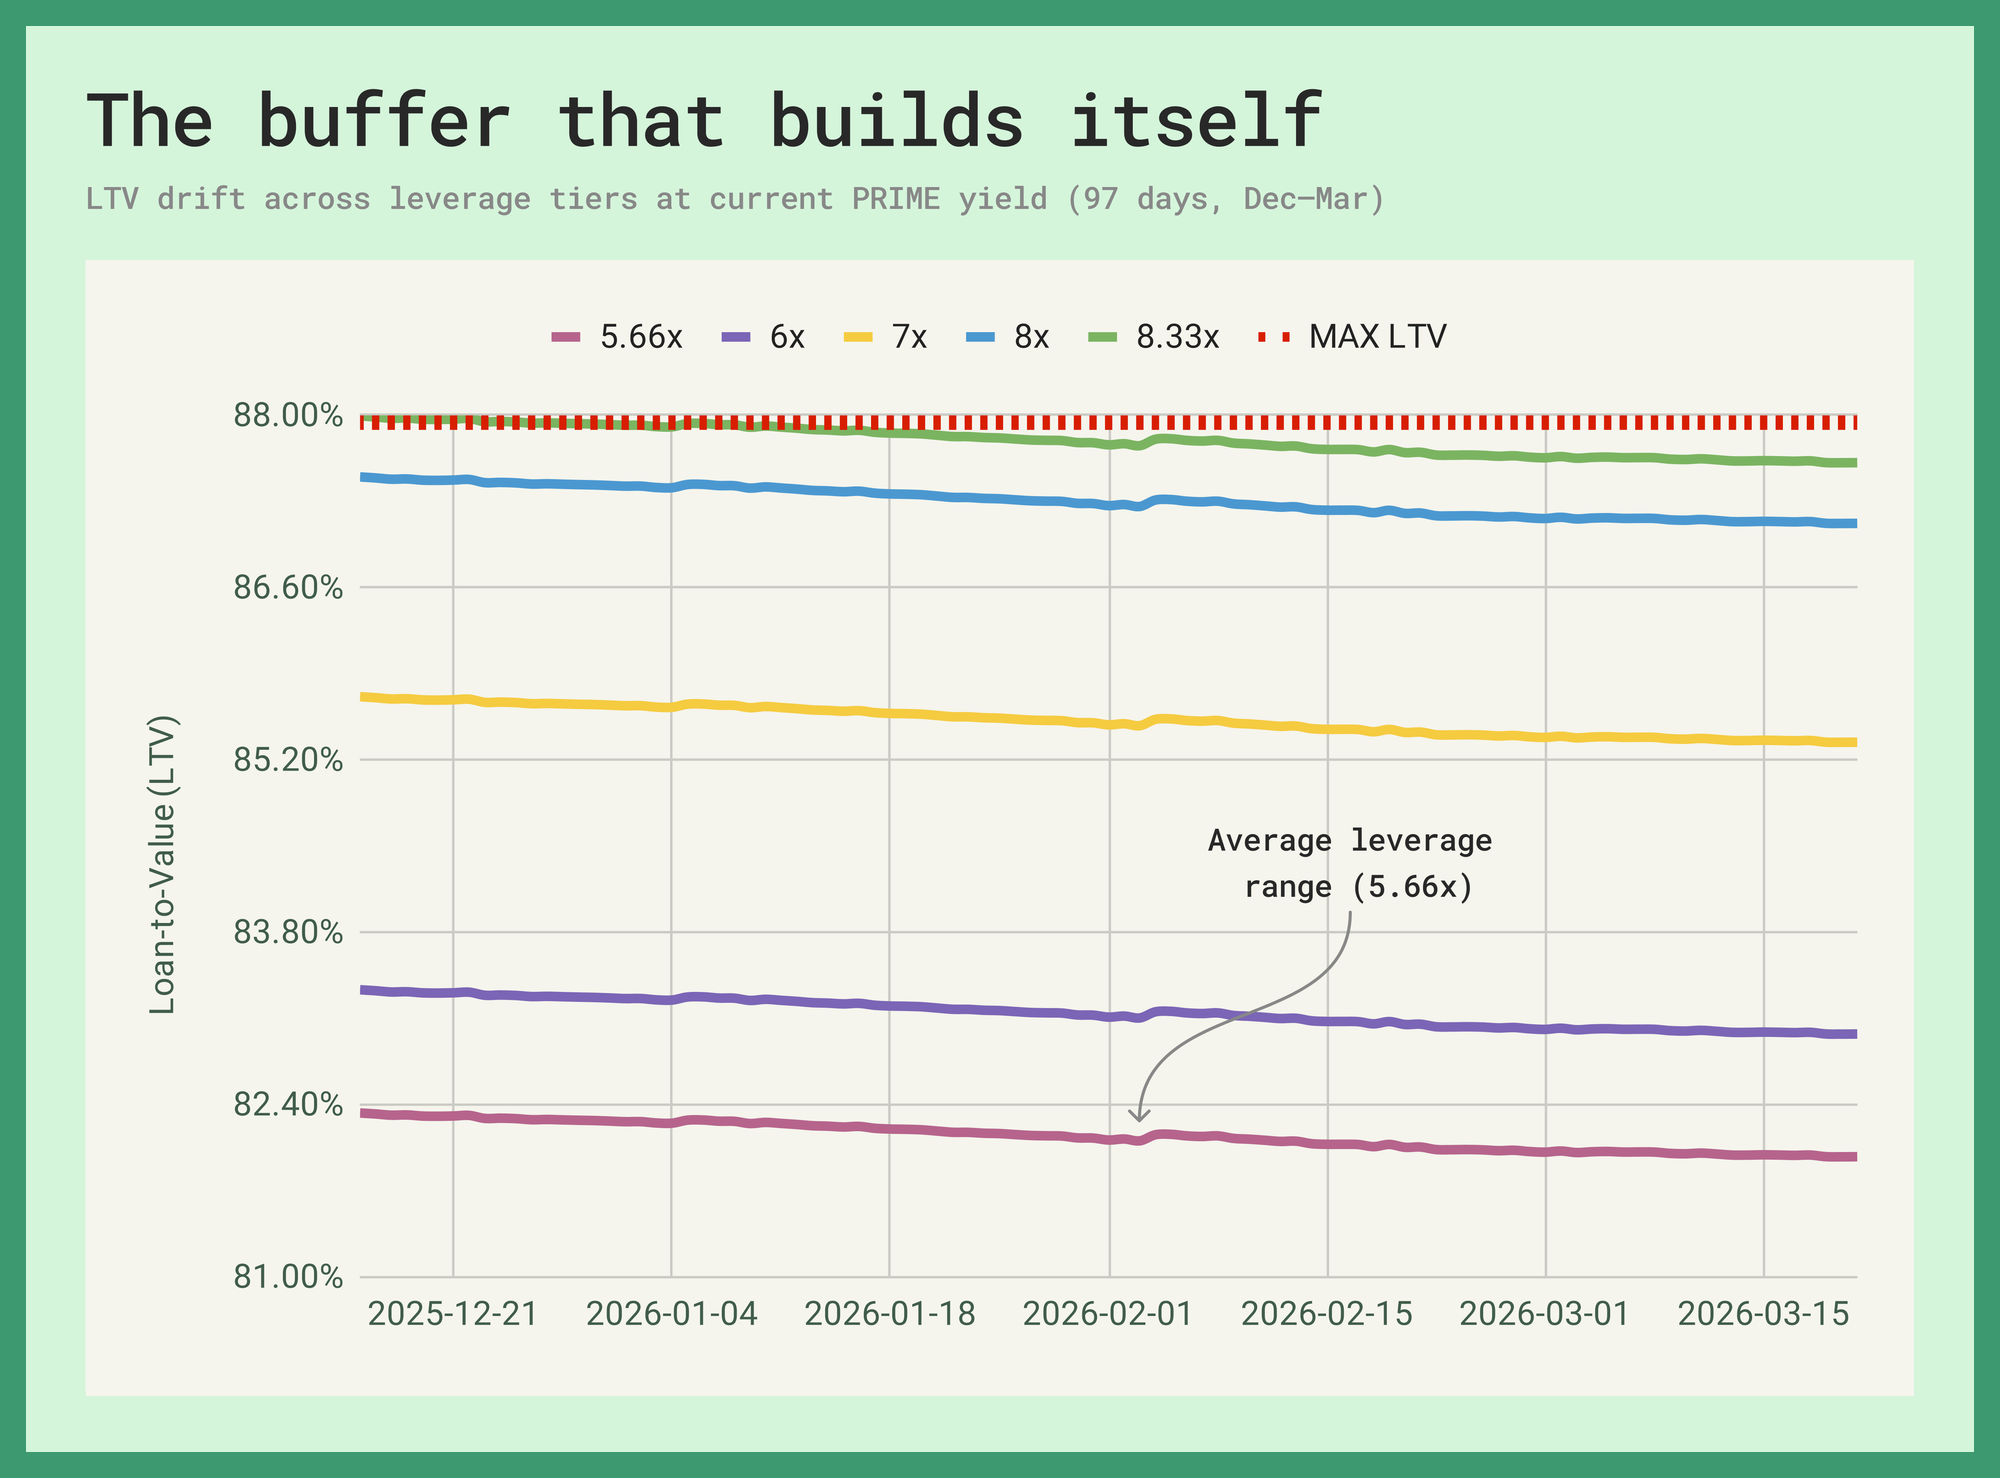
The most expensive borrow at the moment costs 6.88% per annum, collateral value grows faster than debt, and LTV tightens on its own. At an average leverage of 5.66, positions at the median 82.3% LTV are not on a countdown, but are gradually moving further from danger.
The actual risk isn't positional, it's systemic. Every leveraged PRIME position is underwriting the same bet, that the spread between the base asset's yield and stablecoin borrow cost stays positive. If the yield compresses or borrow rates spike past 93% utilization across all four pools, the math flips for everyone simultaneously. The 236 wallets above 85% LTV with $93 million in borrows didn't drift there through erosion. They opened at those levels. They're the first to feel it if the spread inverts.
The Deeper Pool
February's crash pulled the Maple market from $321 million down to $262 million as leverage appetite dropped across the board. It's since recovered to $409.03 million and currently delivers a base yield of 4.19%.
The more interesting finding sits in the borrow rate comparison. The PYUSD pool on Maple is $212.97 million, by far the largest borrow pool in the market, at 61.30% utilization and a 2.68% borrow rate. At 5x leverage, the net yield on a PYUSD loop is 10.36%. On the other hand, USDC with $11.45 million in deposits and 77.31% utilization charges 3.38% to borrow. The same 5x loop returns 7.77%, 259bps less than the PYUSD equivalent.
PYUSD is cheaper despite carrying the bulk of borrow volume because the pool is 16 times larger, deep enough to absorb $130.58 million in active borrows while still sitting at lower utilization than USDC's comparatively thin pool. Most serious capital on Maple has already found PYUSD, the spread persists not because people are avoiding it, but because the pool hasn't been crowded out yet.
Maple's top wallet currently controls 28.6% of total market supply, $63 million from a single address. The second largest holds 21.1%, adding up to 49.7% between the two. The remaining 921 wallets split the other half. Both whales are active borrowers.
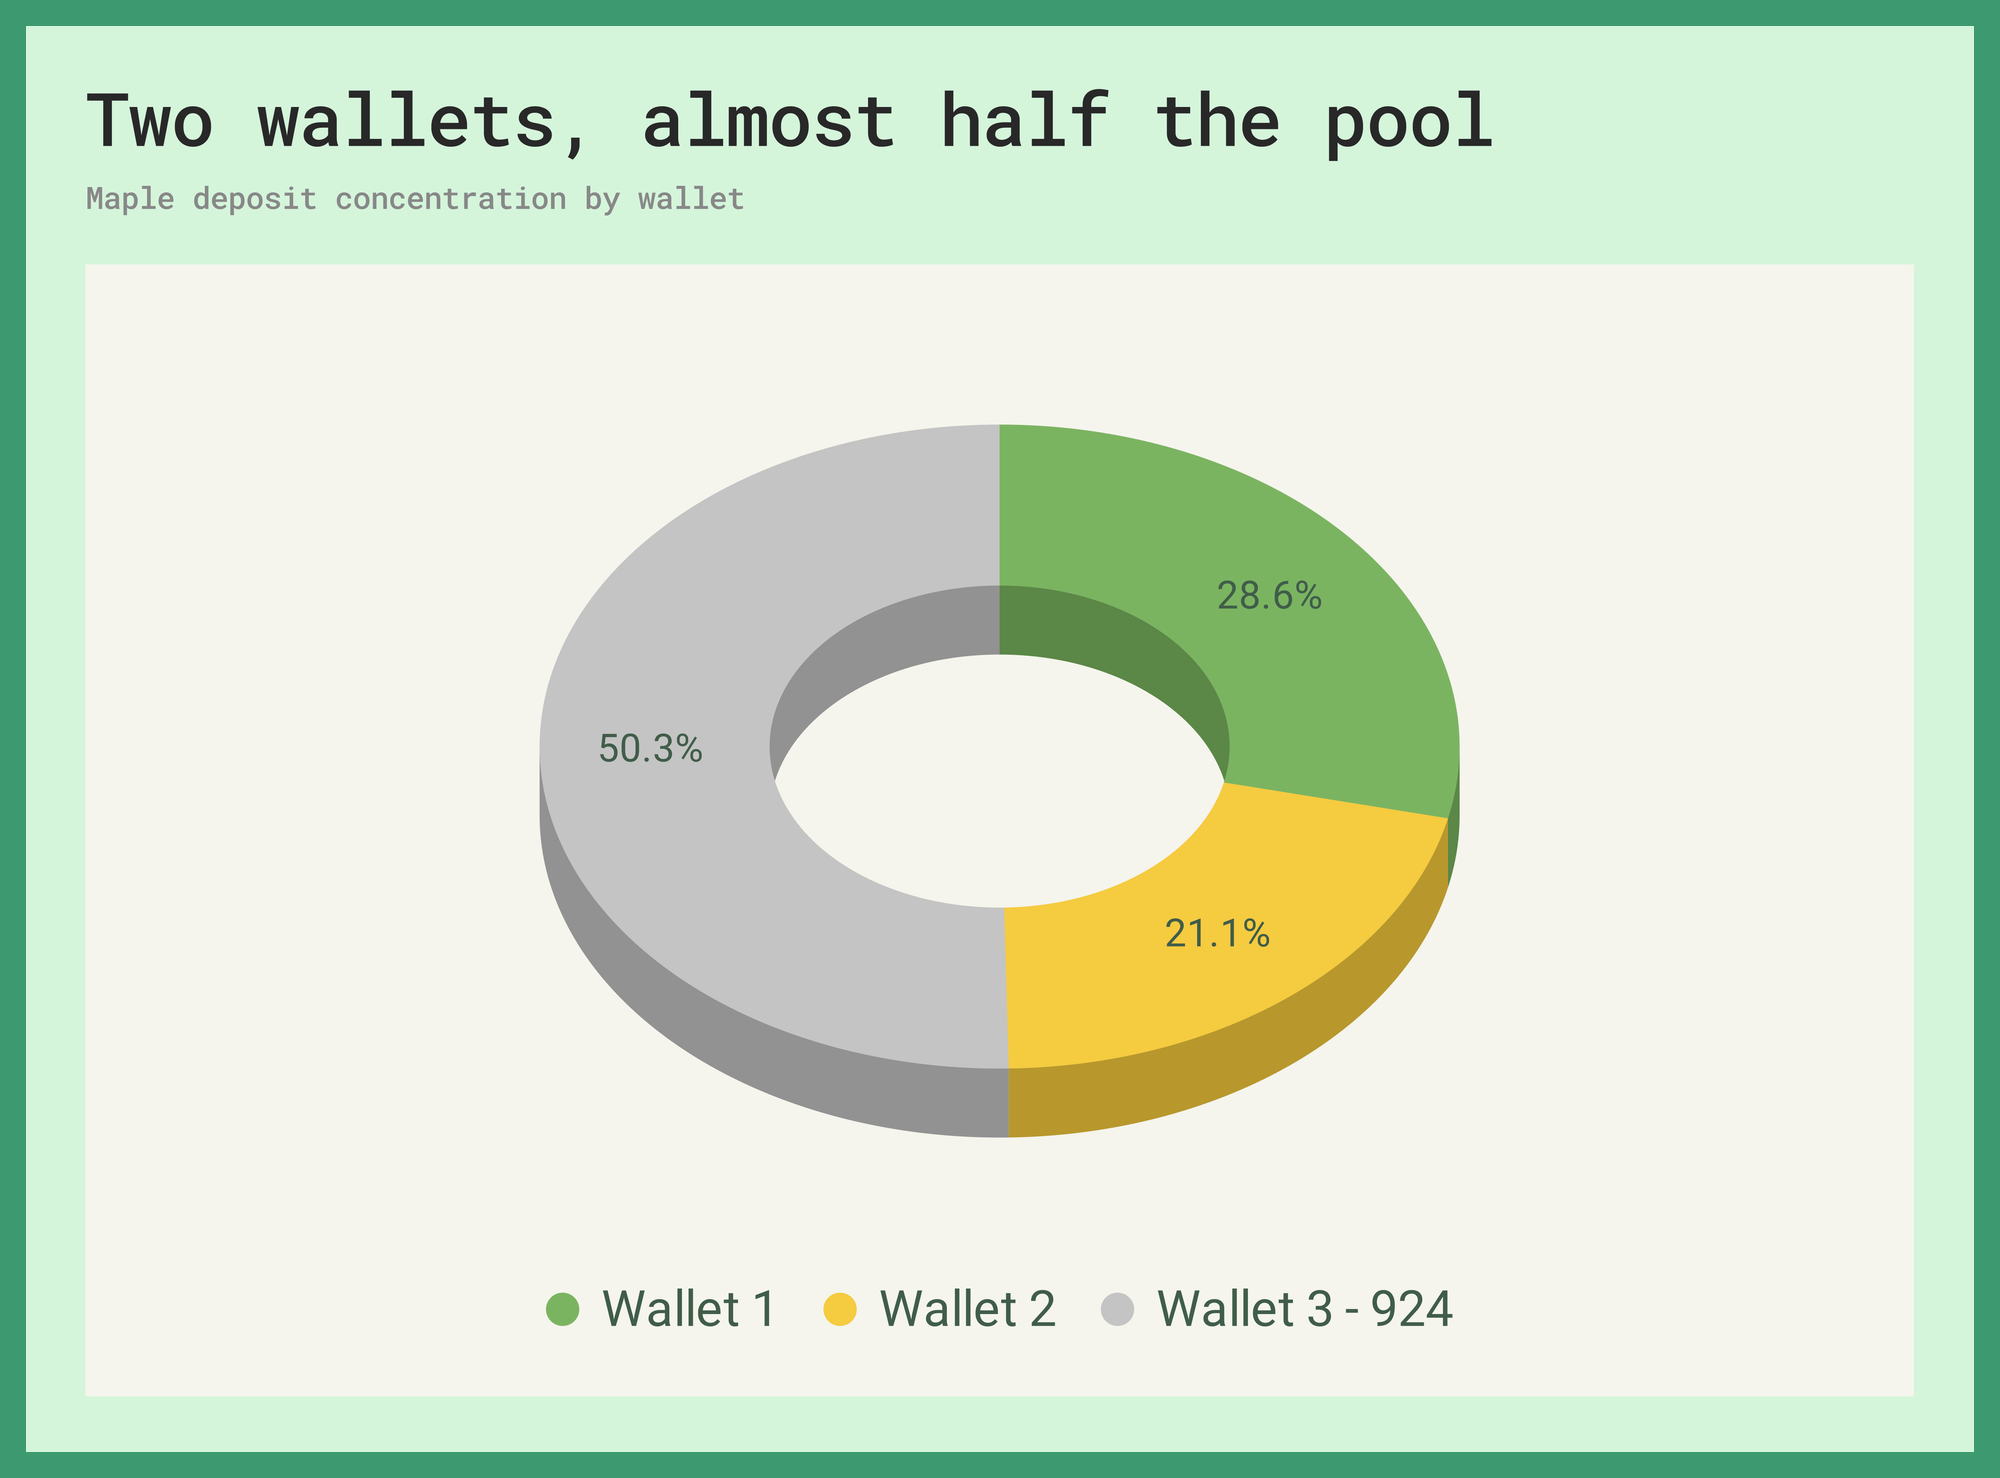
Sudden rate moves that look like a broad demand shift could just be a single entity adjusting their position. If either of these two wallets exits, utilization and rates can drastically move overnight. In that case it would be evident that the market didn't change, but rather a chunk of the supply walked out the door.
The One Nobody Found
OnRe earns yield through reinsurance premiums distributed by Guy Carpenter and Howden. Hurricane season, specialty risk pools, global insurance cycles—none of it has a mechanical relationship to the price of SOL, US interest rates, or anything else in the typical crypto participant's mental model. Its market on Kamino has amassed $99.08 million in deposits and is setting new highs daily. The market's base asset (ONyc) yields 10.23%.
The looping side is documented. 2.5x max leverage on ONyc, returning approximately 11.45% APY at the cap (13.90% with incentives). What's less covered is the supply side.
USDG on OnRe is at 93.34% utilization paying 7.18% supply APY on a $16.17 million pool. Across all five markets, all borrow tokens, all lending pools, that is the highest passive lending rate on Kamino. Higher than USDC into PRIME at 5.75%. Higher than anything on Maple.
At its current utilization ratio, significant new supply would compress the rate quickly. The rate exists partly because not enough people have found it yet. OnRe's wallet structure also reflects this, 52% of TVL controlled by wallets over $1 million versus Maple's 86.3%, with a meaningful mid-tier base (up to $100 thousand) accounting for 14% of deposits. Median borrower LTV sits at 49%, well inside the 50% max. Through both January's and February's SOL crashes, the market recorded zero liquidation activity.
Two Different Markets Under The Same Trench Coat
Tokenized equity is a category, not a strategy. xStocks' total value locked doubled from $191 million to $364 million on March 4th. The onchain signature was a programmatic batch mint with roughly 30 previously small xStock tokens each jumping by ~$5 million on the same day.
- ABBVx (AbbVie) went from $200 thousand to $5.3 million;
- WMTx (Walmart) went from $200 thousand to $5.6 million;
- HONx (Honeywell International) went from $200 thousand to $5.3 million;
The uniformity points to a single entity seeding liquidity across the catalog ahead of a cluster of catalysts: Kraken launching the first regulated tokenized equity perps in late February, xChange and Talos institutional integration going live March 5th, and the xPoints rewards program announced March 10th.
The Kamino xStocks market itself was flat during the initial surge but saw increased flows later on. What's changed since is the points campaign integration. The opportunity on Kamino has two angles. For those who borrow against USDC, xPoints accumulate on every supported stock token: SPYx, QQQx, TSLAx, NVDAx, GOOGLx, MSTRx with up to 1.96% in weekly USDC rewards. Base supply rates on the equities themselves are near zero, so the incentive is entirely external. Early epoch, smaller denominator. For stablecoin suppliers, USDC on xStocks is paying 5.38% supply APY with no additional xPoints on top.
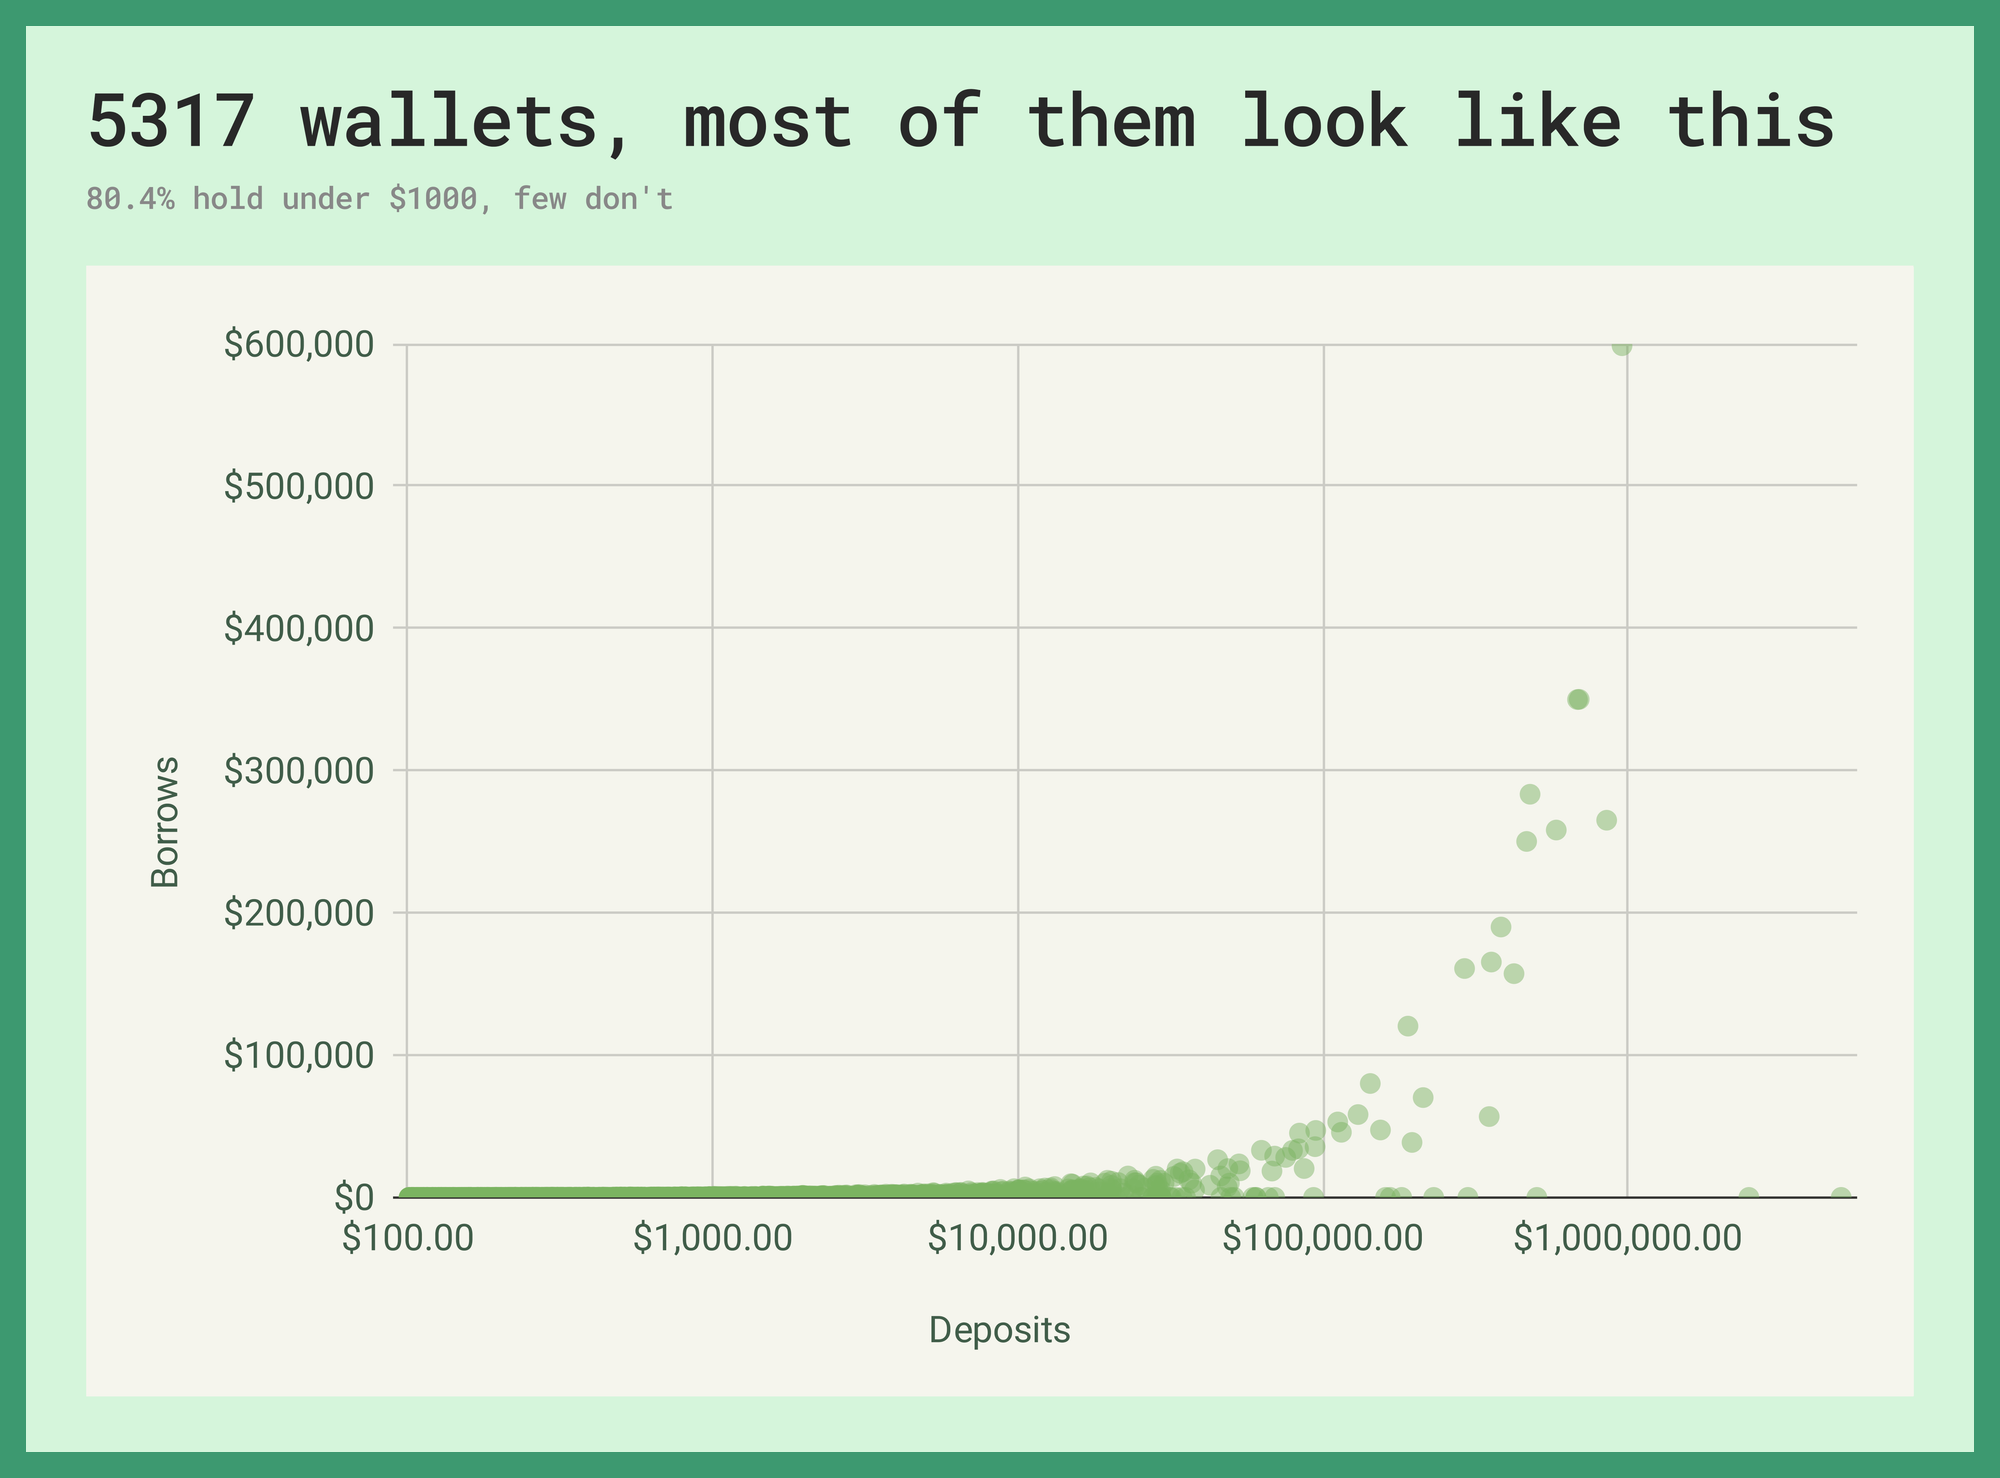
As of writing this article, 5317 accounts are engaging with the market. The median deposit size is $123 and 80.4% of the depositors have a position size of less than a thousand dollars. Only a fourth of the accounts are taking on any debt, meaning that they are only positioning themselves on the supply side. Total obligation count increased twelve-fold in the last ten days. The pace suggests strong interest from farmers positioning ahead of an eventual airdrop.
A third of the wallets are actively borrowing stablecoins against equity collateral and re-depositing for additional points exposure. The loop works, but it introduces notable directional risk. SPYx collateral has a 75% liquidation LTV; TSLAx and NVDAx sit at 65%; MSTRx at 40%. Equities have been declining, and a sustained drawdown compresses the LTV ceiling on the most volatile collateral first. Most positions are small enough for this to be negligible. Larger depositors running the same loop should watch the underlying.
Superstate is the inverse. Five wallets, $45.68 million in deposits, one address at $20 million. SEC-registered equities as DeFi collateral is a genuine first, and the market grew 208% in February when many others slumped. Whether five whales constitute a product thesis or an early signal depends on how "Opening Bell" issuances develop. Too early to know. Worth watching.
Conclusion
The pools know which token is cheapest to borrow, where the buffer is widening, and which rate won't survive the next wave of deposits. They know that positions opened at max leverage are gradually moving further from danger, that a 259bps spread between two borrow tokens on the same collateral is sitting in plain sight, and that the best passive yield on the protocol lives in a $16.17 million pool most users haven't found yet.
The information provided is for general informational purposes only and does not constitute financial, investment, or legal advice. The content is based on sources believed to be reliable, but its accuracy, completeness, and timeliness cannot be guaranteed. Any reliance you place on the information in this document is at your own risk. On Chain Times may contain forward-looking statements that involve risks and uncertainties. Actual results may differ materially from those expressed or implied in such statements. The authors may or may not own positions in the assets or securities mentioned herein. They reserve the right to buy or sell any asset or security discussed at any time without notice. It is essential to consult with a qualified financial advisor or other professional to understand the risks and suitability of any investment decisions you may make. You are solely responsible for conducting your research and due diligence before making any investment choices. Past performance is not indicative of future results. The authors disclaim any liability for any direct, indirect, or consequential loss or damage arising from the use of this document or its content. By accessing On Chain Times, you agree to the terms of this disclaimer.