Trade Dominance, Not Price
Bitcoin dominance is finally tradable, and it is the first version of a broader trade.


For a decade Bitcoin dominance has been charted as if it were an asset. It had a ticker, trendlines, cycle lore, and enough macro-account theology to qualify as a minor religion. What it did not have was a legitimate market, much less a single agreed-upon denominator.
That was tolerable while dominance was only content. A chart can survive being imprecise when nobody settles against it. Once traders can express the view, imprecision becomes collateral damage. Every product has to answer the question the chart could dodge: what counts as the total market?
Crypto can have that discussion in public because supply is observable enough for the denominator to be argued, audited, and eventually traded. The interesting answer in 2026 was not another centralized perp stapled onto a familiar line. It came from on-chain venues that turned the methodology into the product itself. Dominance is finally tradable because someone first had to decide what it means.
Key Points
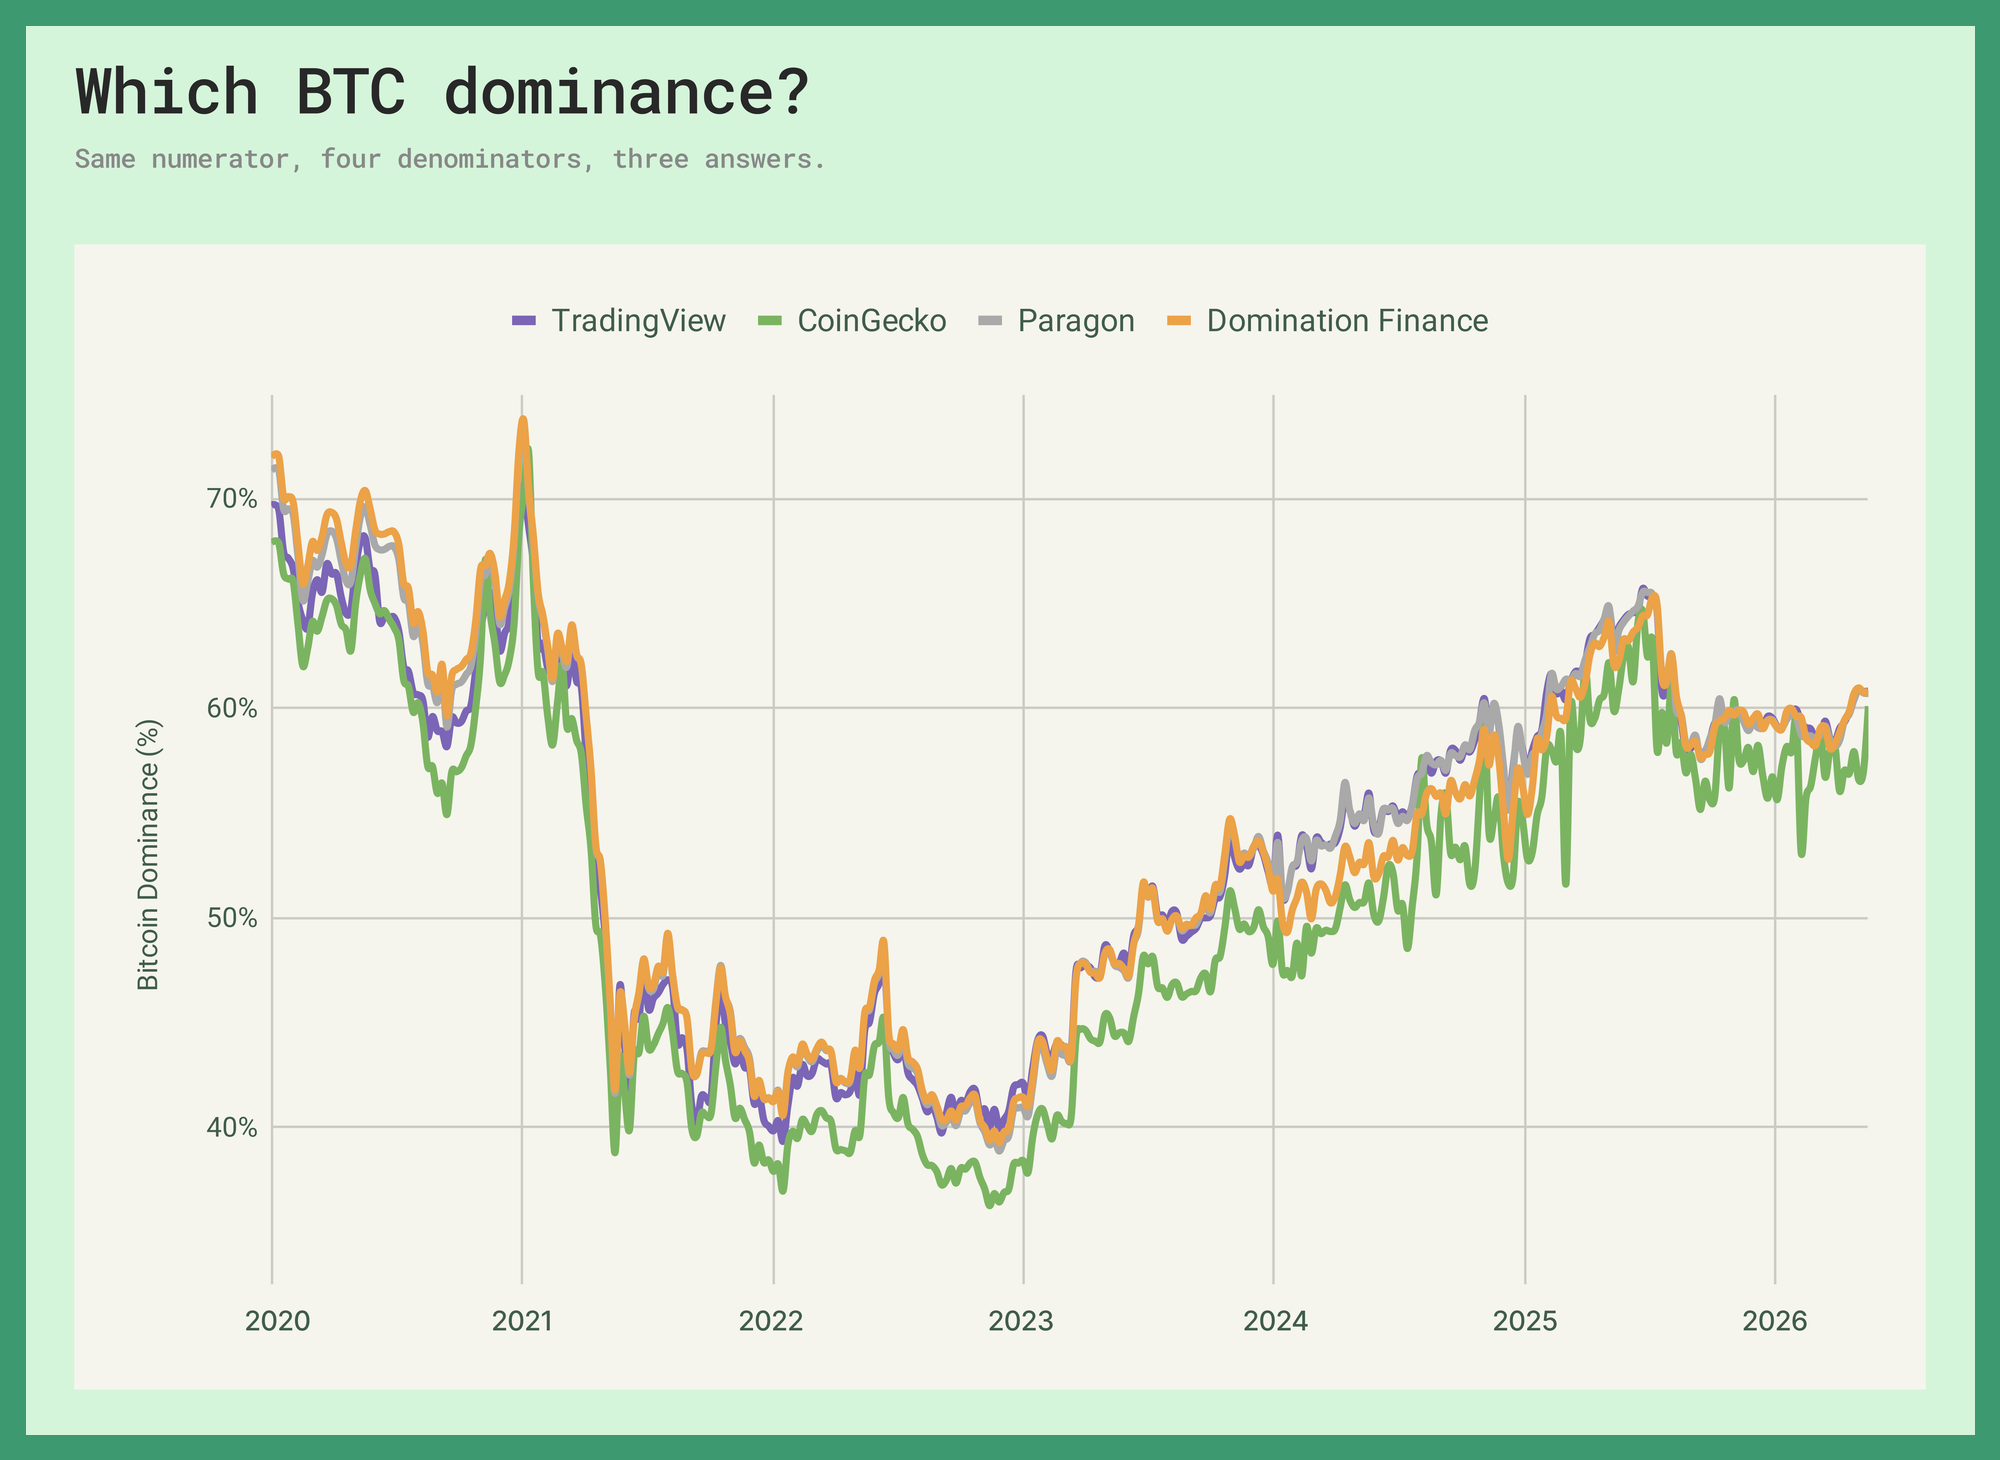
- The commonly referenced BTC.D line sits within 25 bps of the tradable oracles today — TradingView is close to Paragon and Domination, while CoinGecko's broader market-cap series sits 268 bps lower.
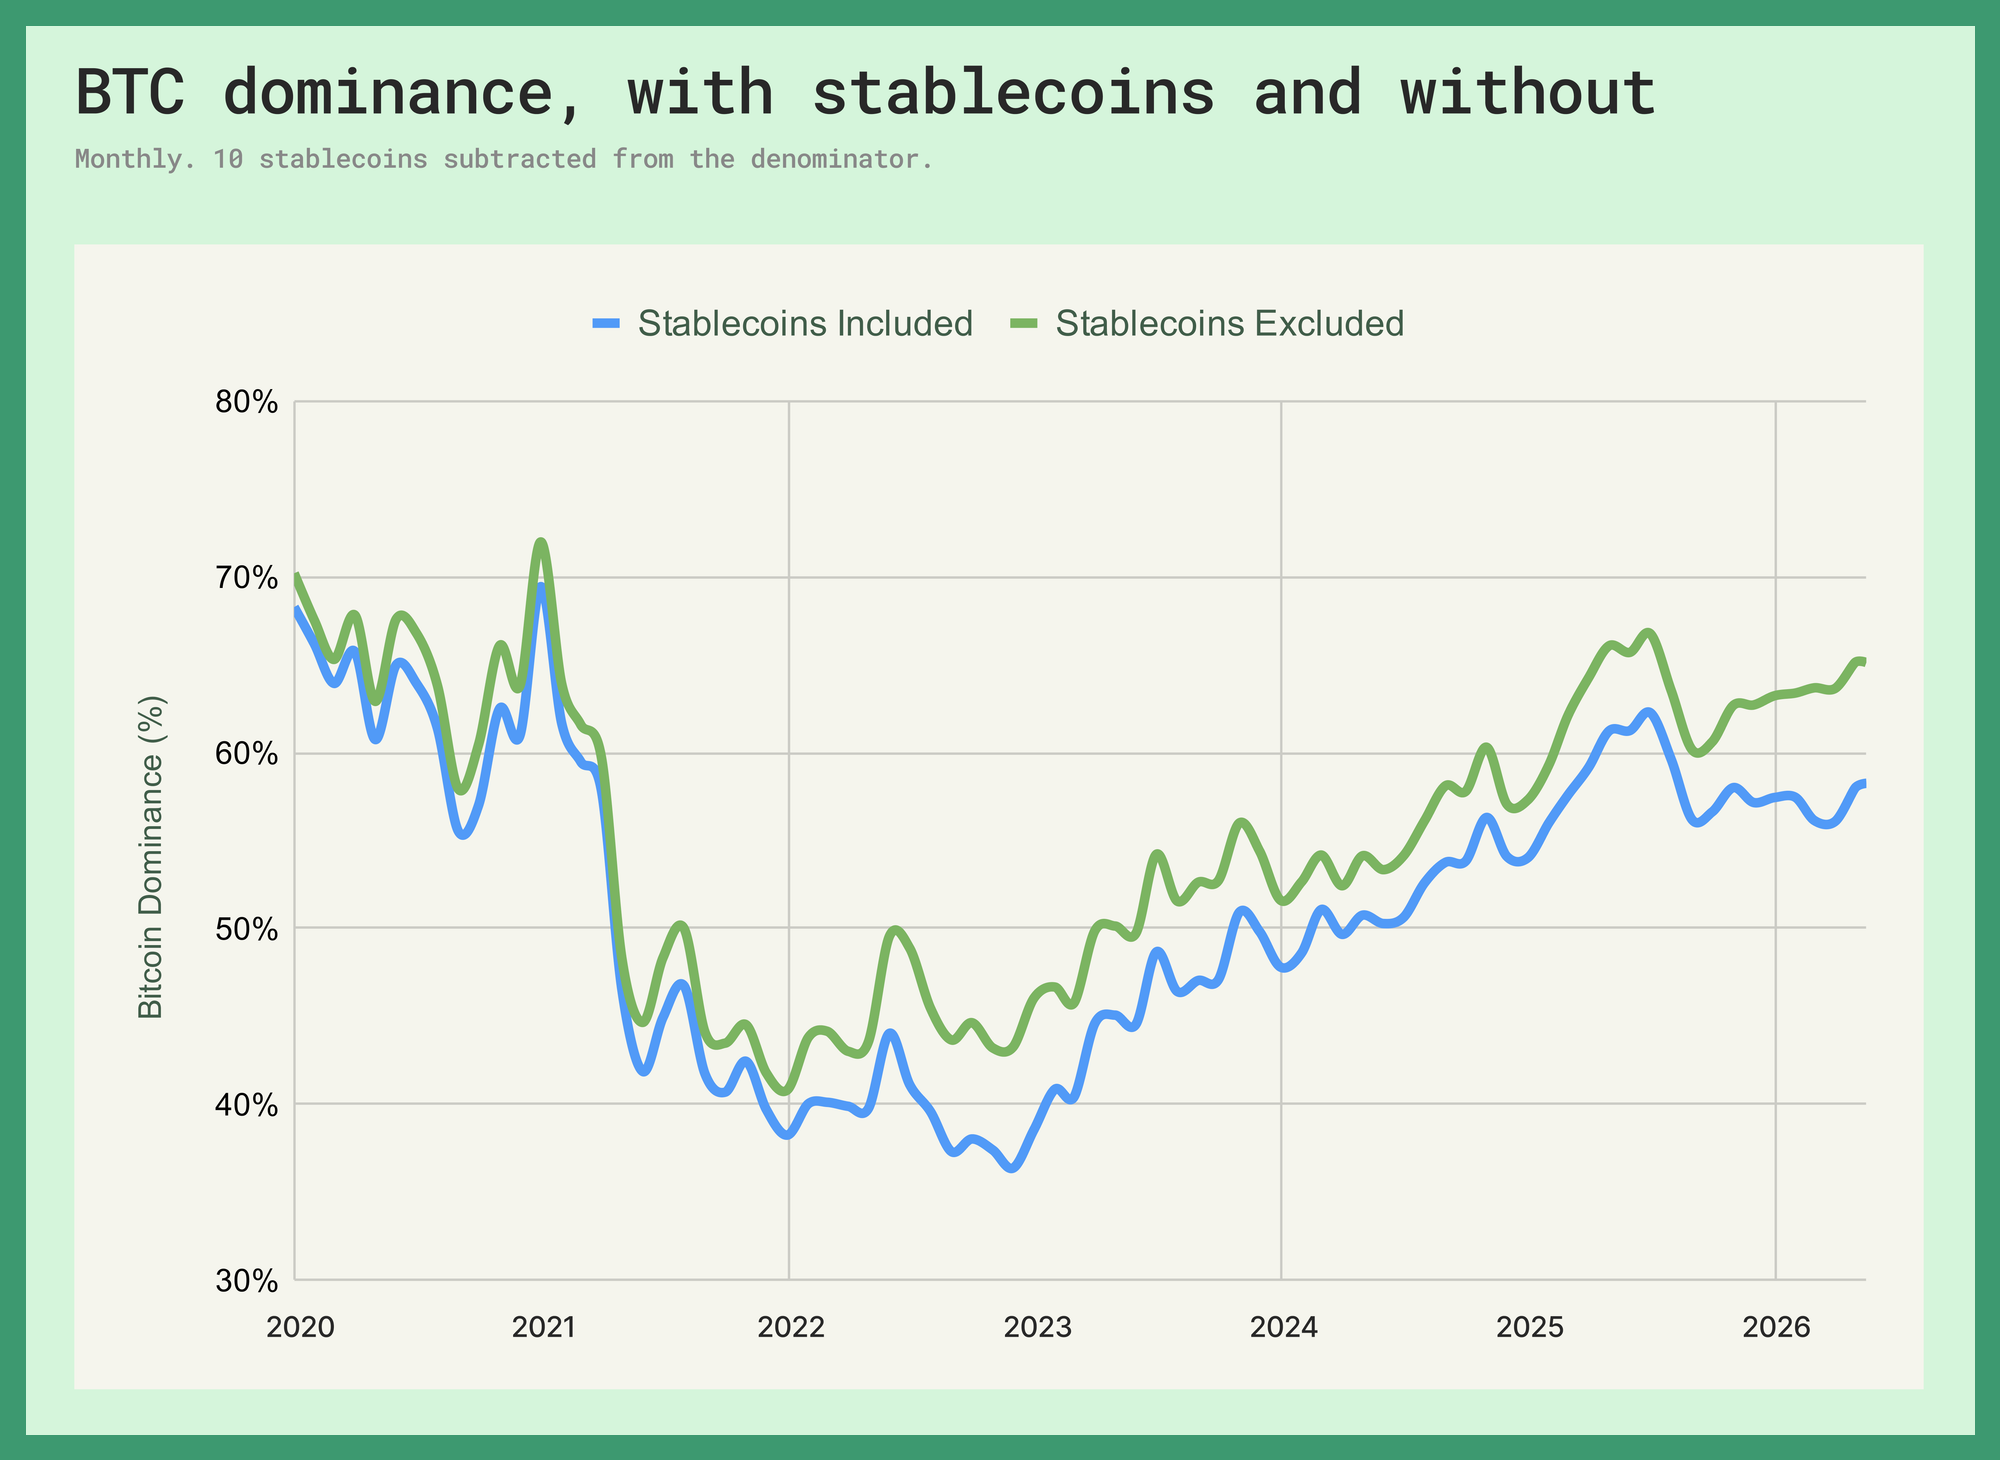
- Stablecoin inclusion alone moves BTC.D by roughly 690 bps today — the gap peaked at 854 bps in June 2022, in the post-LUNA bear, making it the biggest hidden lever in the calculation.
- BTC.D flipped correlation signs 87 times since 2020 — the watched line is not a directional Bitcoin proxy with cleaner branding.
- USDT.D peaked at 9.28% during FTX week — the cleanest risk-appetite signal built from inside the market, driven by denominator compression rather than new Tether minting.
What Dominance is Actually Expressing
Most crypto alpha is beta with a better deck. Long the majors, short whatever basket passes for a hedge, pair-trade two L1s with the same liquidity tourist base, run a basis book until the funding regime decides it has a sense of humor.
Dominance is one of the few cleaner relative-value expressions the market has. It does not ask whether Bitcoin goes up, but whether Bitcoin gains or loses share against the rest of the market, a small distinction on paper and a large one on the calendar.
The blunt version is enough. Put Bitcoin's quarterly returns beside quarterly moves in the TradingView BTC.D line. No funding, no borrow, no product replica, just the watched dominance line against the asset it supposedly explains.
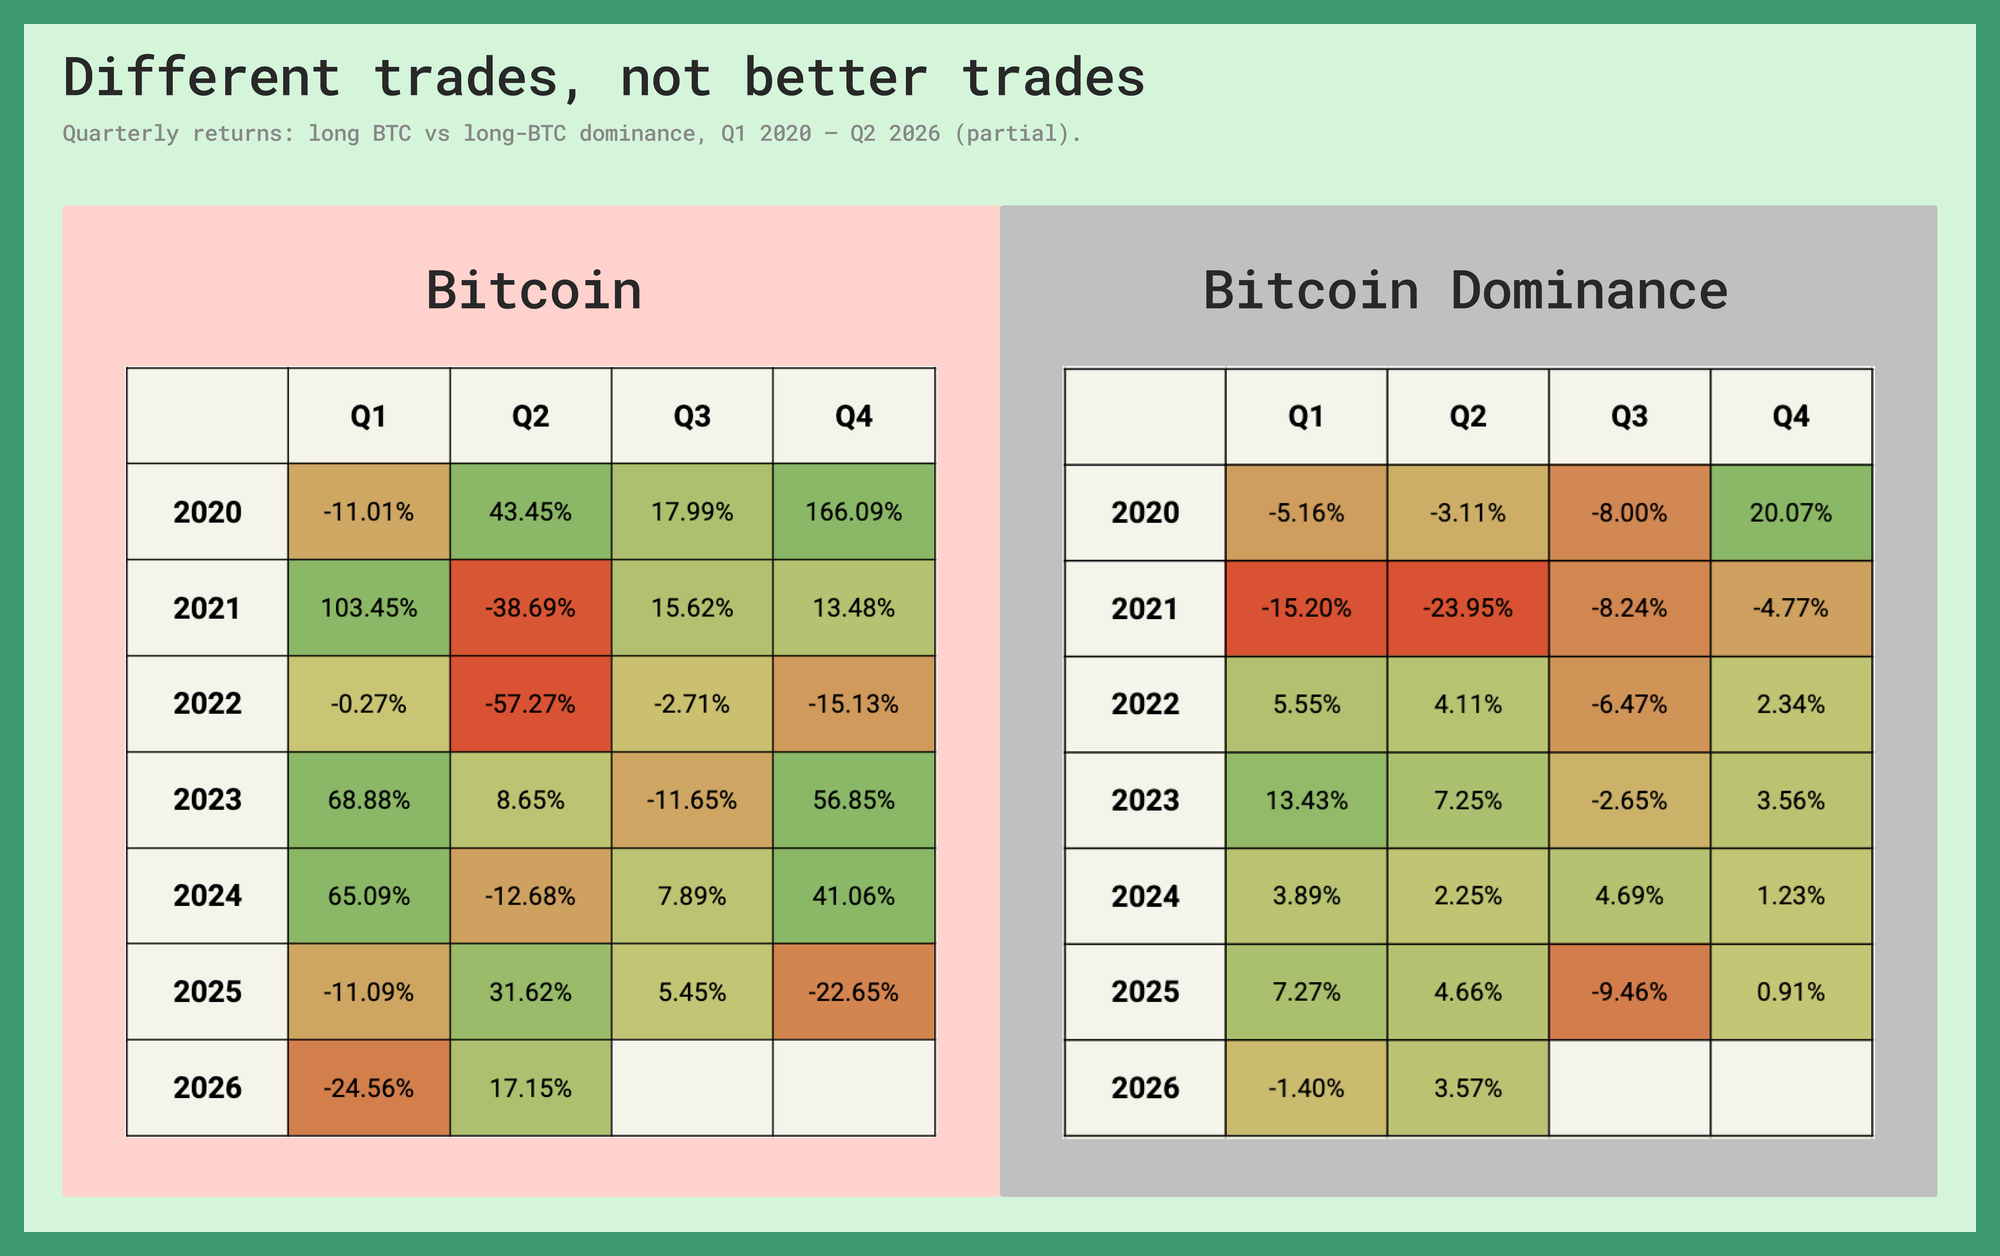
2021 and 2022 make the point with unusually good comic timing. The nostalgic bull market year was catastrophic for dominance, which fell in all four quarters. Bitcoin's 2022 collapse did the opposite, with dominance green in three of four quarters while the asset bled through the year. The same split showed up again in quieter form in 2025, when the four quarterly cells compounded to Bitcoin down 4.5% and dominance up 2.6%. Across 26 quarters since 2020, 12 had opposite signs. Owning Bitcoin and trading its market share are not the same view at different sizings.
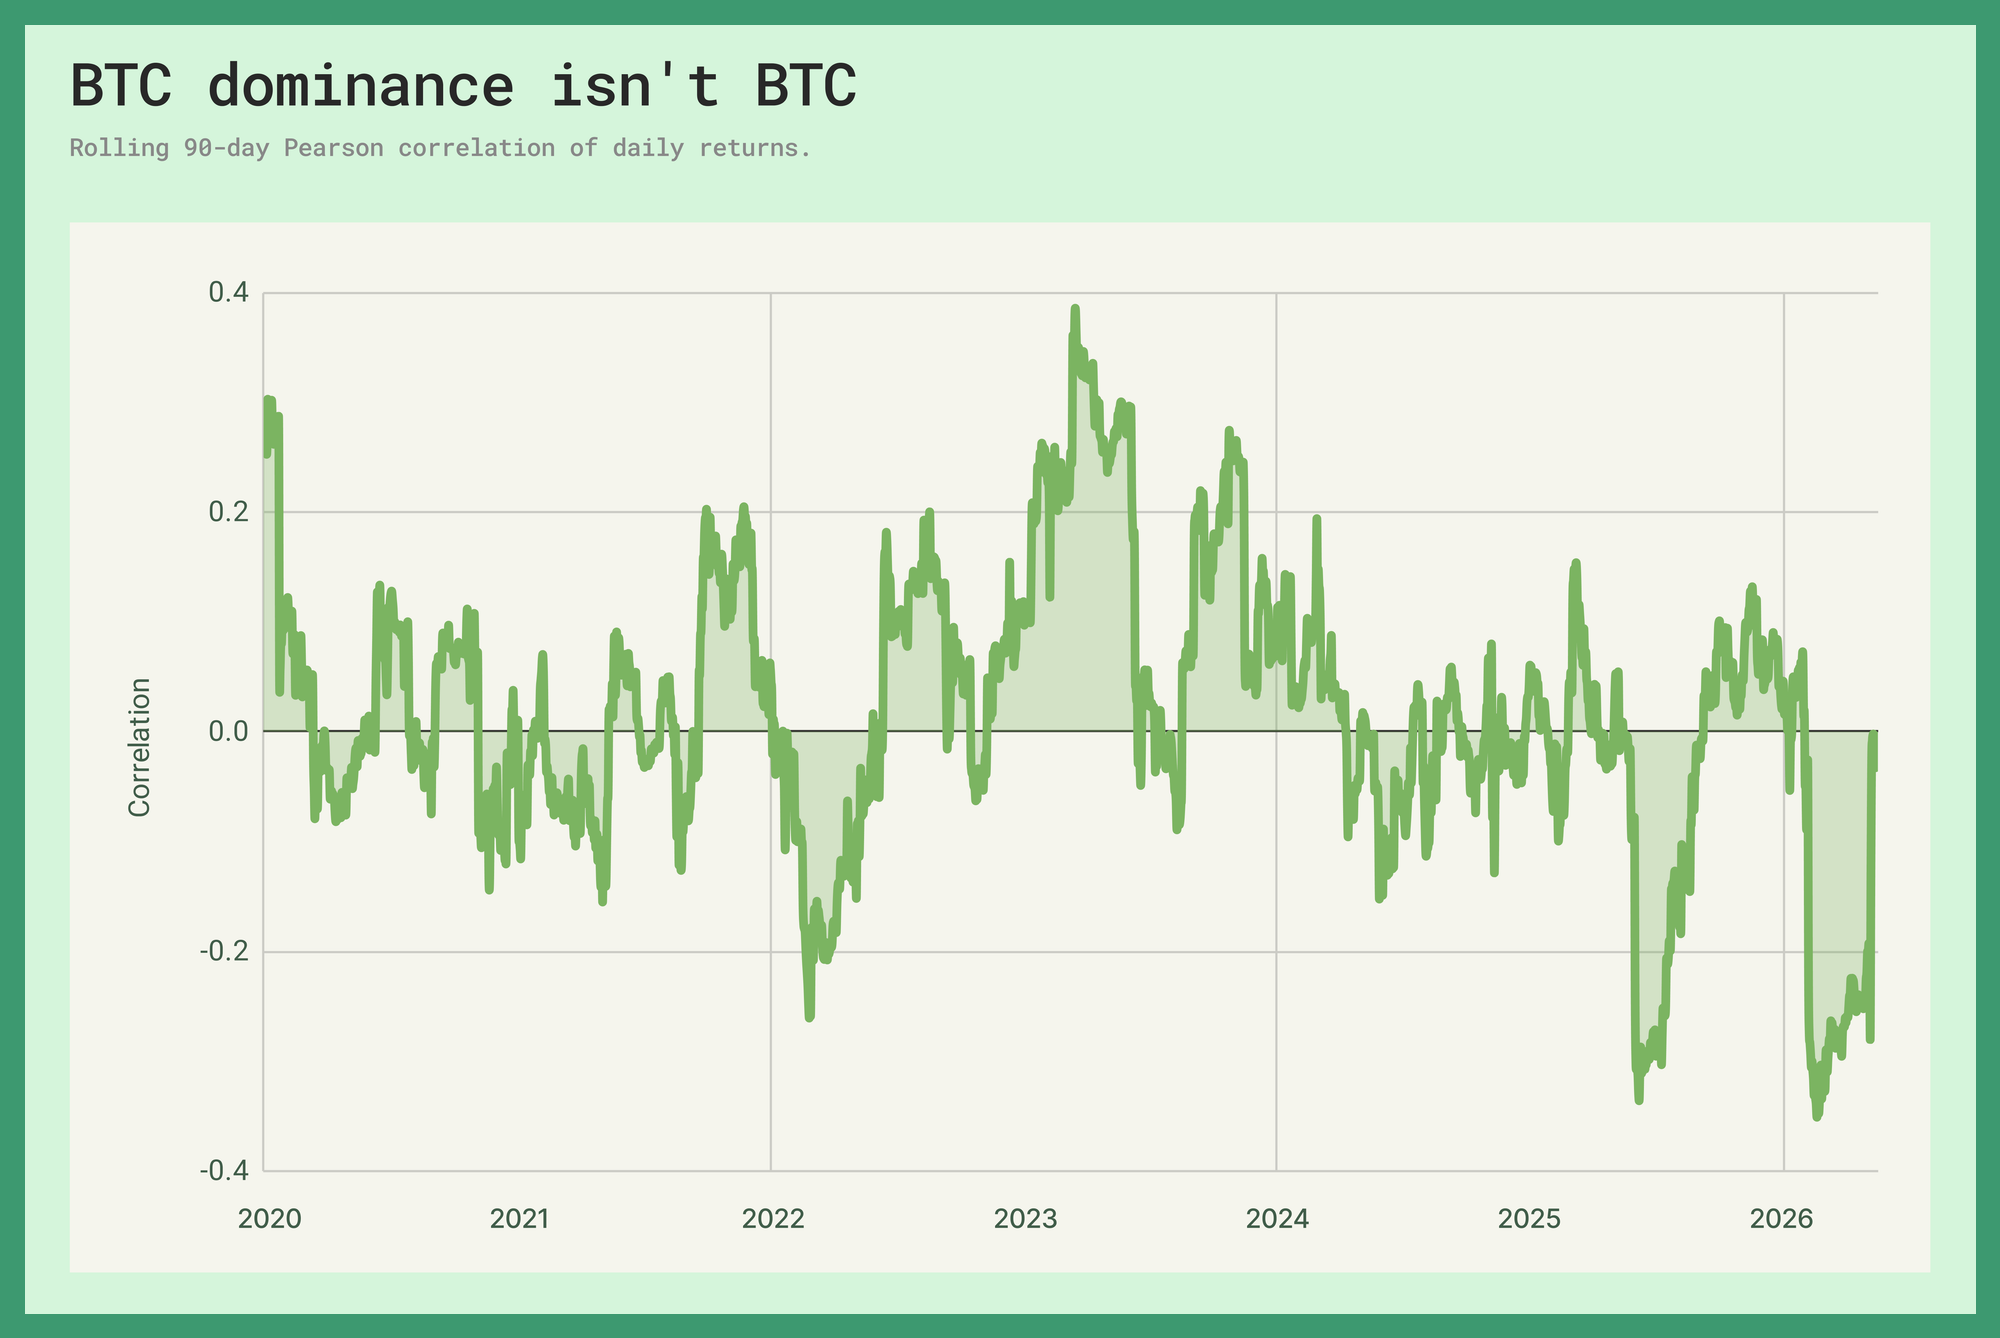
The statistical version is less cinematic and more irritating. The rolling 90-day correlation between dominance and spot returns flipped signs 87 times across the dataset. The point is not that dominance always moves against Bitcoin. It is that the relationship is too unstable to be treated as Bitcoin wearing a disguise.
That instability is why BTC.D should be read as the first dominance trade, not the whole category. USDT.D is the cleaner cousin, a risk-appetite gauge built from inside the market. In a panic, Tether's float is not usually what moves. Everything around it gets marked down.
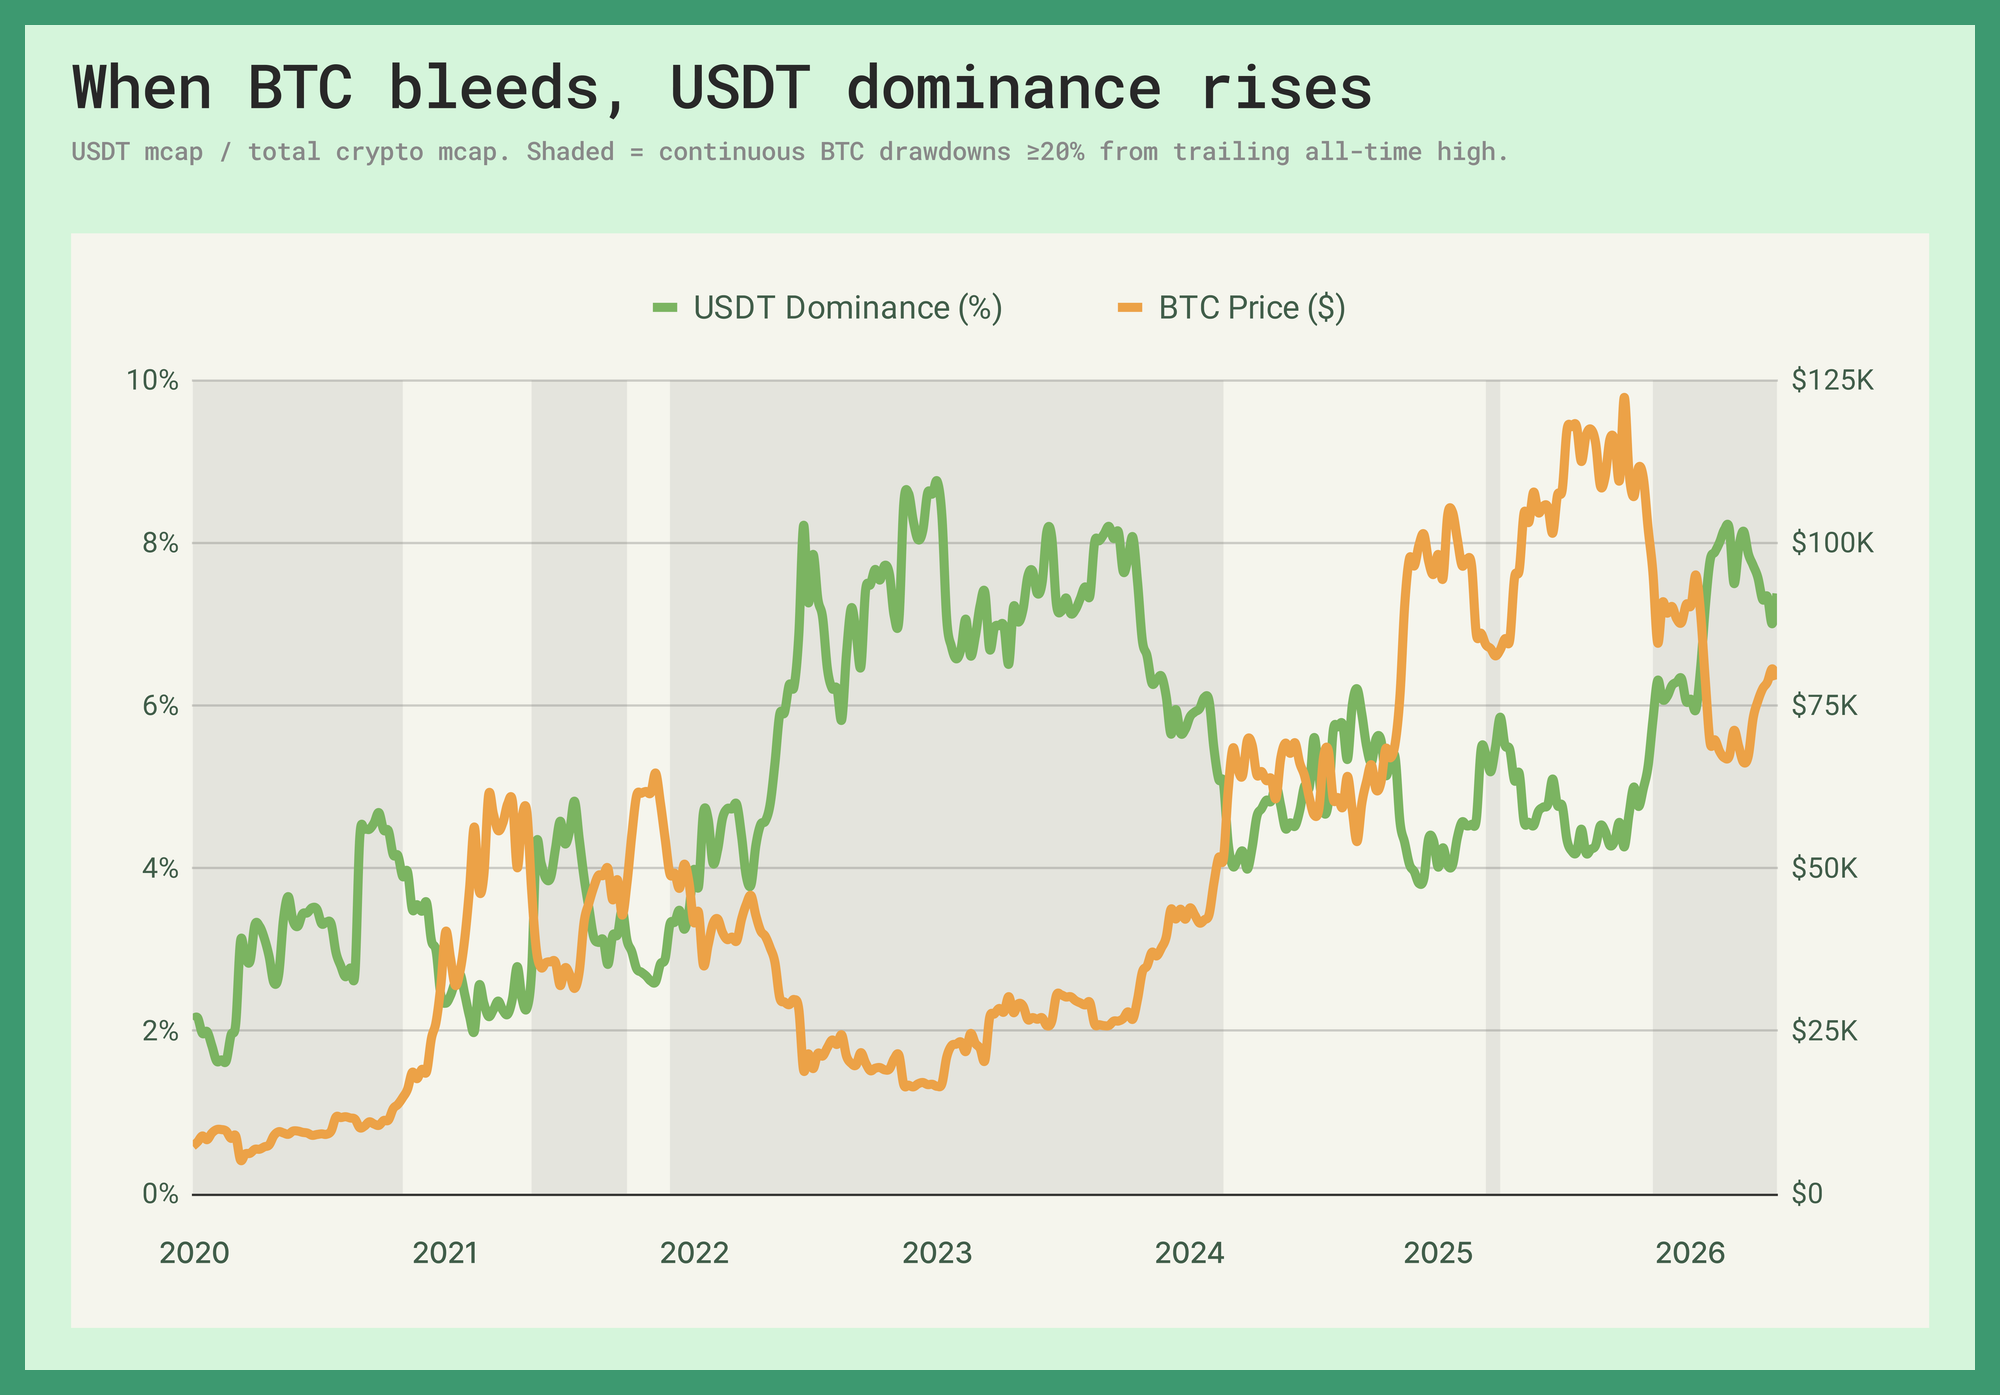
The cleanest spike in the dataset came during FTX week, with its share hitting 9.28% in November 2022, days after Alameda's balance sheet started circulating. The mechanism was denominator compression, not Tether minting billions on demand. Stablecoin supply is sticky relative to the rest of the stack. When Bitcoin and alts fall against that sticky base, the stablecoin share rises mechanically. The signal works because the bleed is the panic.
A venue offering five dominance pairs is asking a different question than a venue offering one. Dominance is a broader expression, not a single line about Bitcoin.
The Denominator Problem
Methodology is where the revised charts got more interesting. TradingView, Domination Finance, and Paragon now cluster tightly. CoinGecko is the broad-market outlier. On the latest date, TradingView sits within 25 bps of the two tradable oracles, while CoinGecko sits 268 bps lower.
Numerator-side disputes are almost insultingly small. Bitcoin's supply is legible, its prices converge across liquid venues, and any remaining disagreement lives in basis points. The denominator is not an implementation detail. It is where the product lives. Total market capitalization looks like a constant right up until it becomes the contract.
Stablecoins are the largest lever by distance. Count USDT, USDC, DAI, BUSD, USDS and the rest of the core USD float as crypto, and BTC.D is one number. Treat those balances as cash on the sidelines, and it is another. In the current data, that single decision moves the value by nearly seven percentage points. At the post-LUNA peak on June 19th, 2022, it moved the line by 854 bps.
Both choices have intellectual cover. Stablecoins are on-chain value, and excluding them can make "total market cap" sound more ideological than measured. They are also dollar claims, and including them in the same denominator as SOL, DOGE, and whatever the market is pretending to understand this month changes the economic meaning of the ratio. The problem is not that one convention exists. The problem is that the chart label rarely tells you which convention you are trading.
Universe construction comes next. CoinGecko's public total is a broad global market cap across more than 16 thousand tracked assets, and CoinGecko says crypto-backed wrapped, bridged, and staked tokens are excluded from that global number to avoid double-counting. Domination Finance and Paragon narrow the job with top-125 or top-200 universes, venue-specific supply logic, and explicit settlement rules. TradingView lands near them, but remains an observed chart series rather than a settlement spec.
Market size also needs a liquidity check. A token can be enormous on paper and irrelevant in practice. That is why Domination Finance's denominator is liquidity-weighted rather than pure market-cap-weighted: the oracle is not just asking what an asset is worth, but whether that value belongs in a settlement feed traders can actually use.
That tradeoff gets louder outside BTC.D. Bitcoin is the forgiving case: liquid, universal, and hard to argue with. Move down the market-cap table and the methodology starts showing its teeth. Float, wrappers, venue coverage, and liquidity weights matter more when the numerator is no longer Bitcoin.
Domination Finance and Paragon differ more in design than in today's BTC.D print. Basket size, weighting, supply sourcing, and exclusion logic all matter, but barely move the latest number. That makes TradingView useful, not authoritative. A trend line may survive because the watched chart is close to the oracles today. A price target does not, because close is not settlement. The real split is between a line useful for analysis and a methodology money can settle against.
From Synthetic Exposure to Native Products
Dominance has no spot market. No one is delivering a percentage sign into settlement. Every trade depends on an index methodology.
Before the recent products, the only workable expression was long Bitcoin and short a basket of alts. That meant managing constituents, borrow, rebalances, derivatives, stablecoin treatment, and whatever accidental methodology the spreadsheet had inherited. The trader thought they were expressing a market view. They were also running an index business, badly and without charging fees.
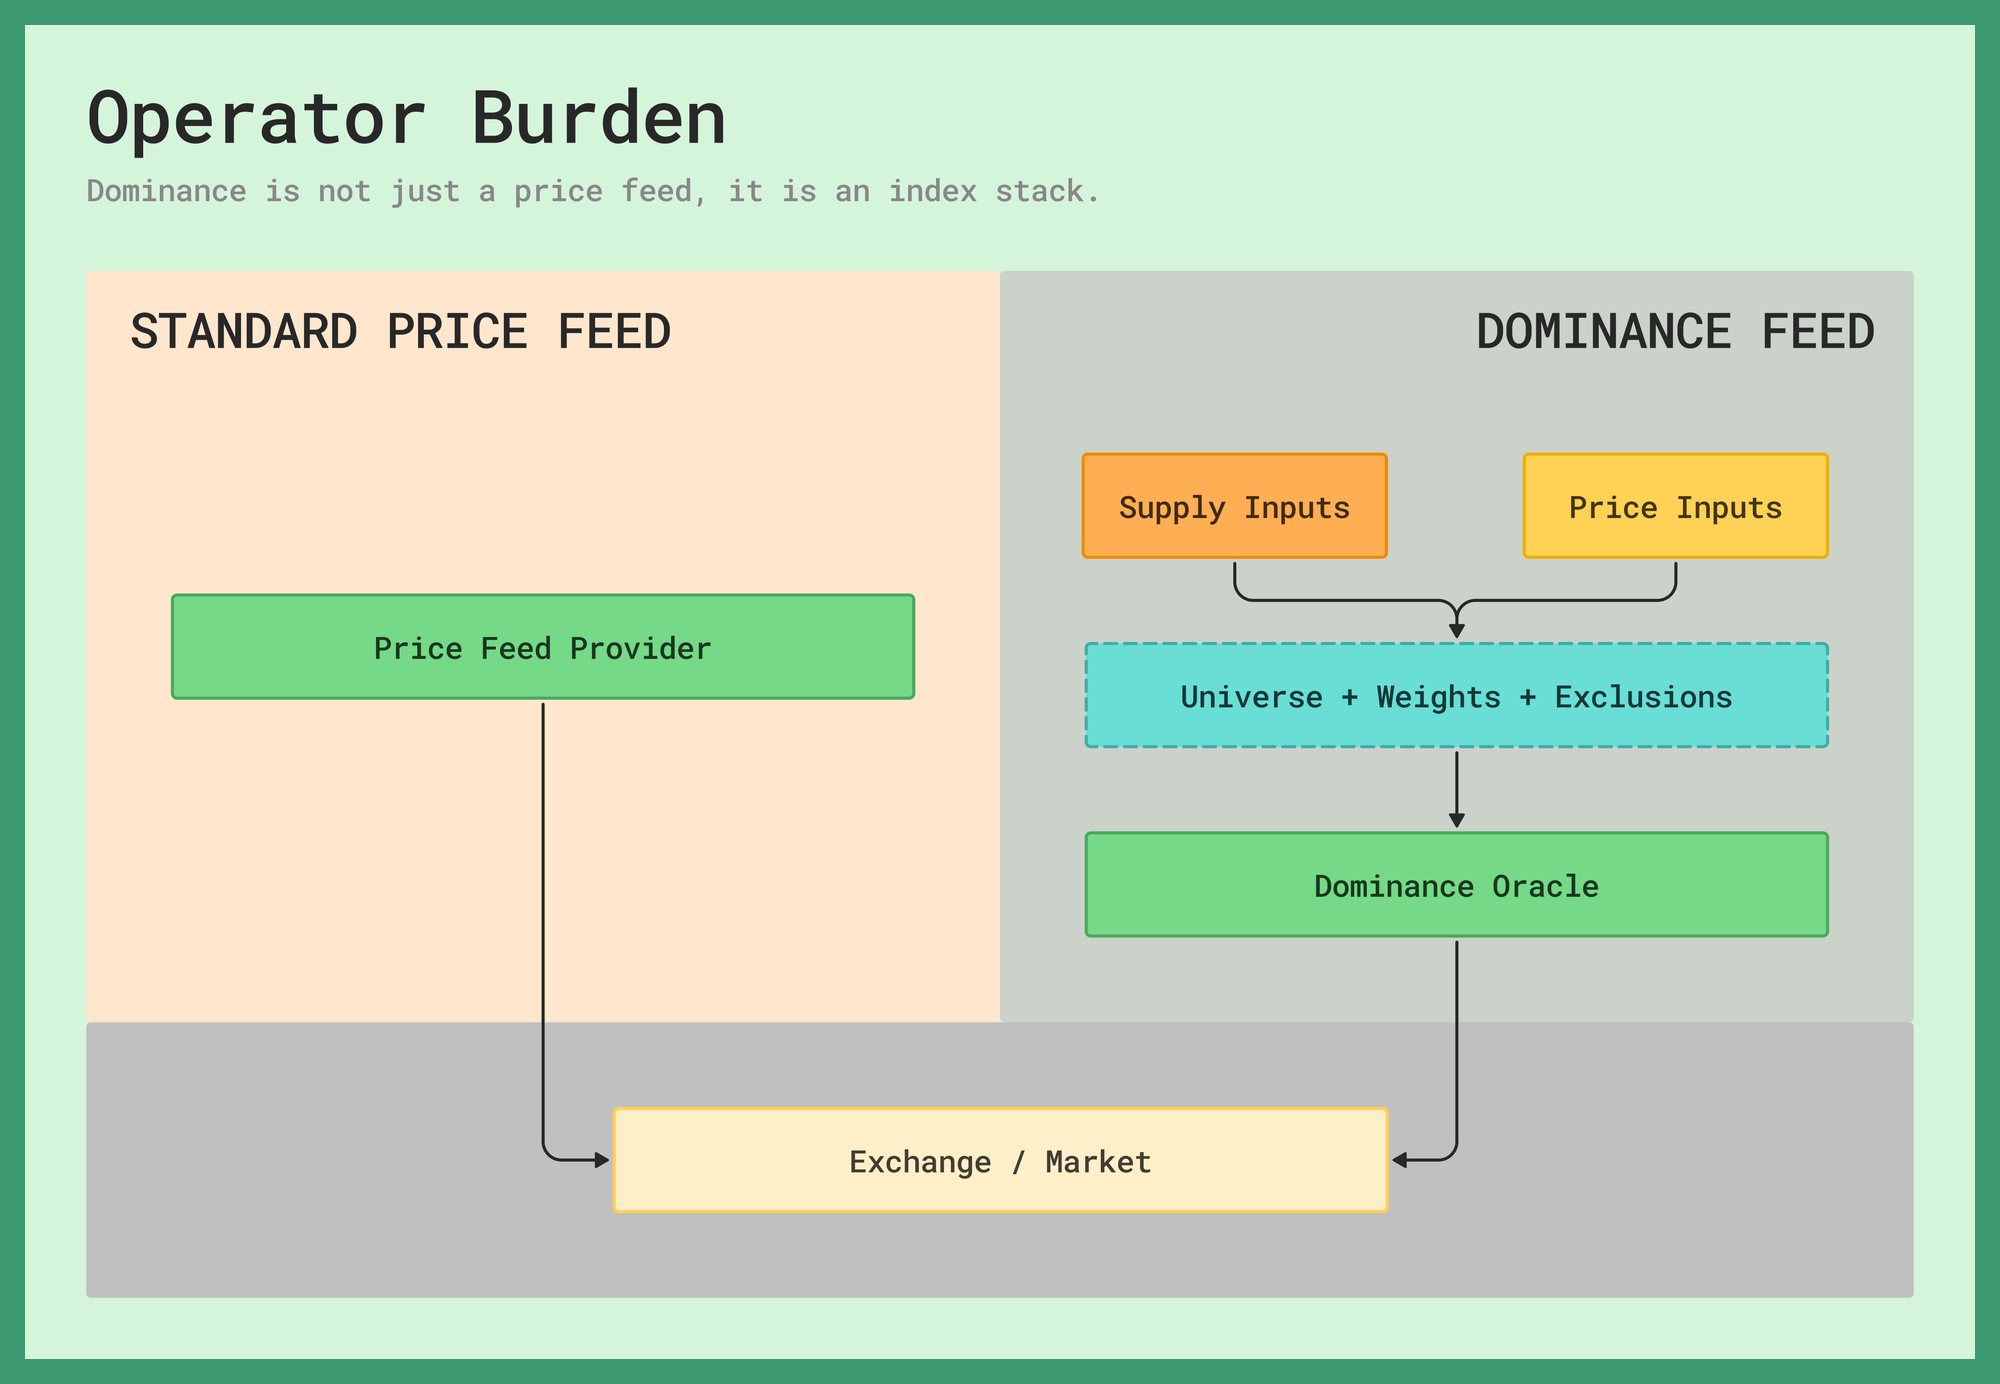
Two things had to converge before that could become a product. First came oracle infrastructure mature enough to publish a reconstituted index with documented inputs, fallback logic, anomaly checks, and a route into execution. Then came the cultural part: traders becoming comfortable settling synthetic exposure against a number they cannot redeem.
What makes dominance crypto-native is not the ratio. Equities have sector weights, index weights, free-float adjustments, ETF flows, and plenty of respectable substitutes for admitting the denominator is messy. Crypto's advantage is a 24/7 ledger where supply, wrappers, constituent sets, and exclusions can be argued from observable data. Imperfectly, but out in the open.
Binance proved there was demand for Bitcoin-versus-alts exposure, but BTCDOM is not market-cap dominance in the sense this piece is concerned with. Its trust model is venue authority, with a closed index, a single market, and enough liquidity to make the product real.
For market-cap dominance, the live products are better read as two answers to what makes a methodology trustworthy.
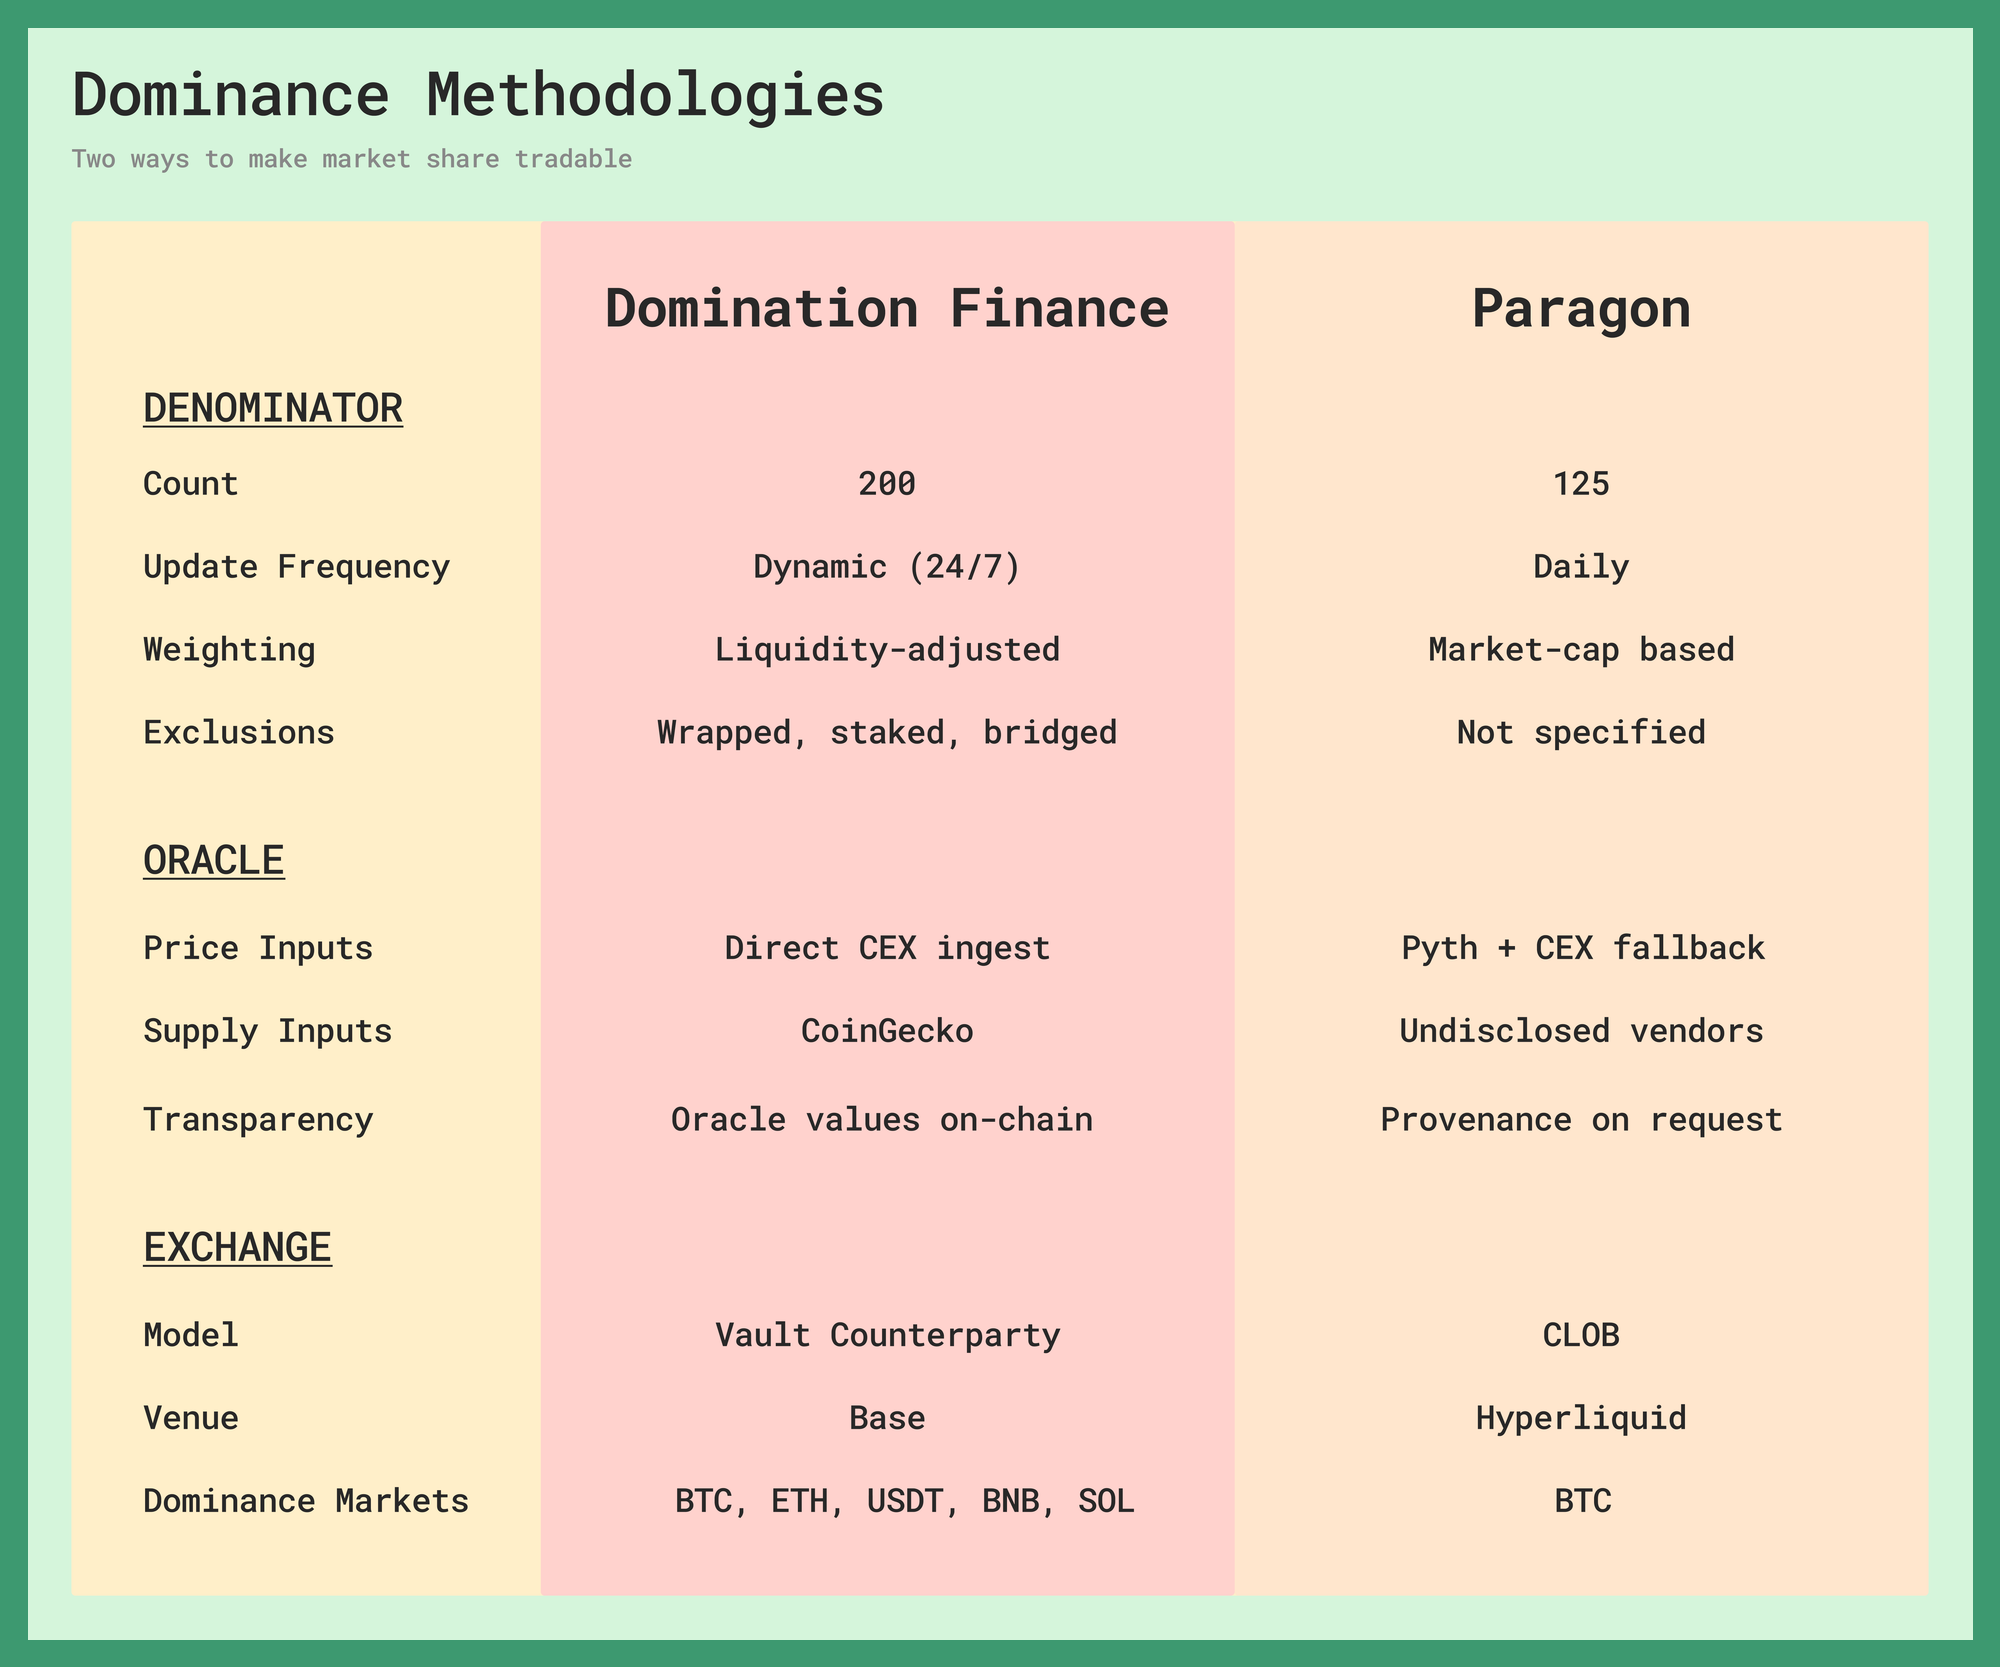
Domination Finance hardens the formula. It publishes the denominator, weights constituents by liquidity, strips derivatives, and puts a vault on the other side of trades that settle to the published oracle. That vault is not a patch for thin liquidity. It is the design choice you get when the product has no natural inventory.
Paragon turns the index into market discovery. It publishes the index machinery, routes Bitcoin dominance through Hyperliquid's HIP-3 stack, and lets a central limit order book (CLOB) decide where synthetic dominance should trade.
The convergence matters because two open venues reached nearly the same number through different mechanics, and the watched TradingView chart is close to both. Maybe that is independent confirmation. Maybe it is shared homework. More likely, it is the boring force of constraints. Once the universe is narrow, supply inputs are defined, liquidity is weighted, and the denominator is public, there are only so many defensible answers left. That is the reference shift. When money trades against dominance, the chart that made the concept famous becomes context. The settlement oracle becomes the market.
The Contract
Dominance was easy when it was just a chart. You could draw the line, argue the cycle, and never ask who was responsible for the denominator. Tradable dominance removes that luxury. The venues that made it real did the boring work first. They defined the market, published the methodology, and let money trade against the result. The watched line can be close. It can even be useful. But close is not settlement. The contract is the methodology.