The Leverage Ladder
Price discovery is on break, yield isn't.

Disclaimer
This report is made in collaboration with Kamino and is therefore sponsored. All editorial decisions, opinions, and conclusions expressed are entirely those of our own and remain independent of any external influence.
Key Points
- Yield outperformed spot in 87% of tested strategies — Across 2,133 Multiply variants, most loops were profitable over 30 days.
- RWAs delivered the cleanest risk-adjusted returns — Assets like PRIME and ONyc scaled efficiently with leverage, with returns driven by native yield rather than price volatility.
- Borrow rates decide winners and losers — Identical assets diverged sharply across markets, as higher funding costs on isolated venues eroded returns and capped viable leverage.
Introduction
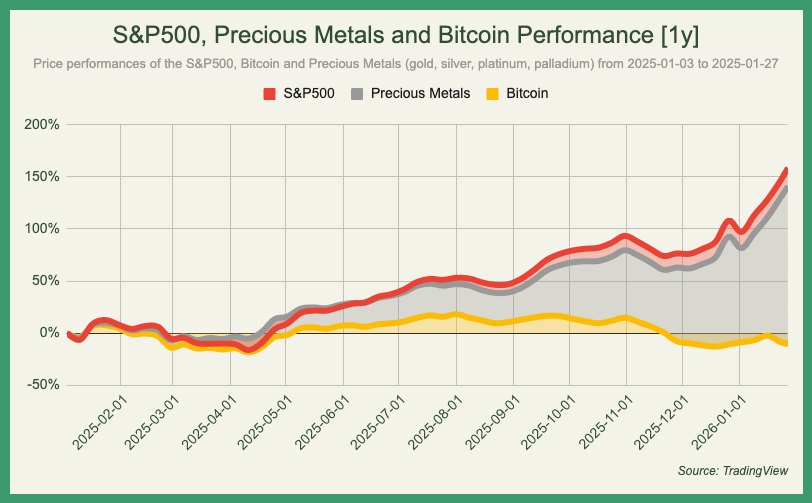
With each passing day, having meaningful directional exposure to crypto seems to become increasingly difficult to justify to oneself, loved ones and even the accountant. For the handful of people still holding tightly onto their magic internet coins, the transition into the new year has been nothing short of mortifying. Faced with global economic uncertainty and the looming threat of continued currency debasement, metals and US equities rally, while Bitcoin, often touted as a hedge for those exact conditions, is struggling to catch a bid.
As for the performance of altcoins, we prefer to not speak on the matter because it's not nice to kick a man while he's down, even more so if they've been there for what seems like an eternity with no visible desire of getting back up again.

Chasing returns derived purely from asset appreciation in a traditional sense has been challenging, for quite some time and is something that we have frequently pointed out. This notion serves as a subtle reminder that there is solace to be found in yield. Contrary to popular belief, despite all the high fully diluted valuation & low float merchants, grifters and scammers, some companies in the space actually generate revenue, with accompanying structured products that serve as vehicles for distributing said proceeds. The returns of which might not be as glamorous or praiseworthy on Twitter as hitting a lick on an illiquid shitcoin, but at the end of the day, making any money is better than losing it.
Equalizer
Leverage deserves caution, not taboo. In well-structured yield loops, informed leverage can materially outperform market benchmarks rather than merely track them. The growing availability of instruments, particularly real world assets (RWAs), combined with the composability of permissionless money markets and improved user experience, has significantly lowered the barrier of entry for strategies once reserved for sophisticated market participants.
Kamino, a longtime patron of the newsletter, exemplifies this approach through Multiply. A straightforward product with over $541 million in deposits, enabling looping collateral against debt to amplify yield or take leveraged directional bets in a single transaction. Built atop the platform’s bread-and-butter lending and borrowing market, it supports 56 distinct supply and borrow token pairs across multiple categories and continues to expand with the protocol’s foundation.
Because leveraged strategies are highly sensitive to changing borrow rates and other factors, historical returns can be difficult to interpret. Accurate analysis often requires data to be aggregated from multiple, sometimes undocumented API endpoints. To a prospective user, the inability to conduct due diligence without Python scripting is far from ideal. This data gap has recently been bridged by the introduction of a dedicated backtesting widget that simulates historical position performance over a defined time range based on existing market and protocol data.
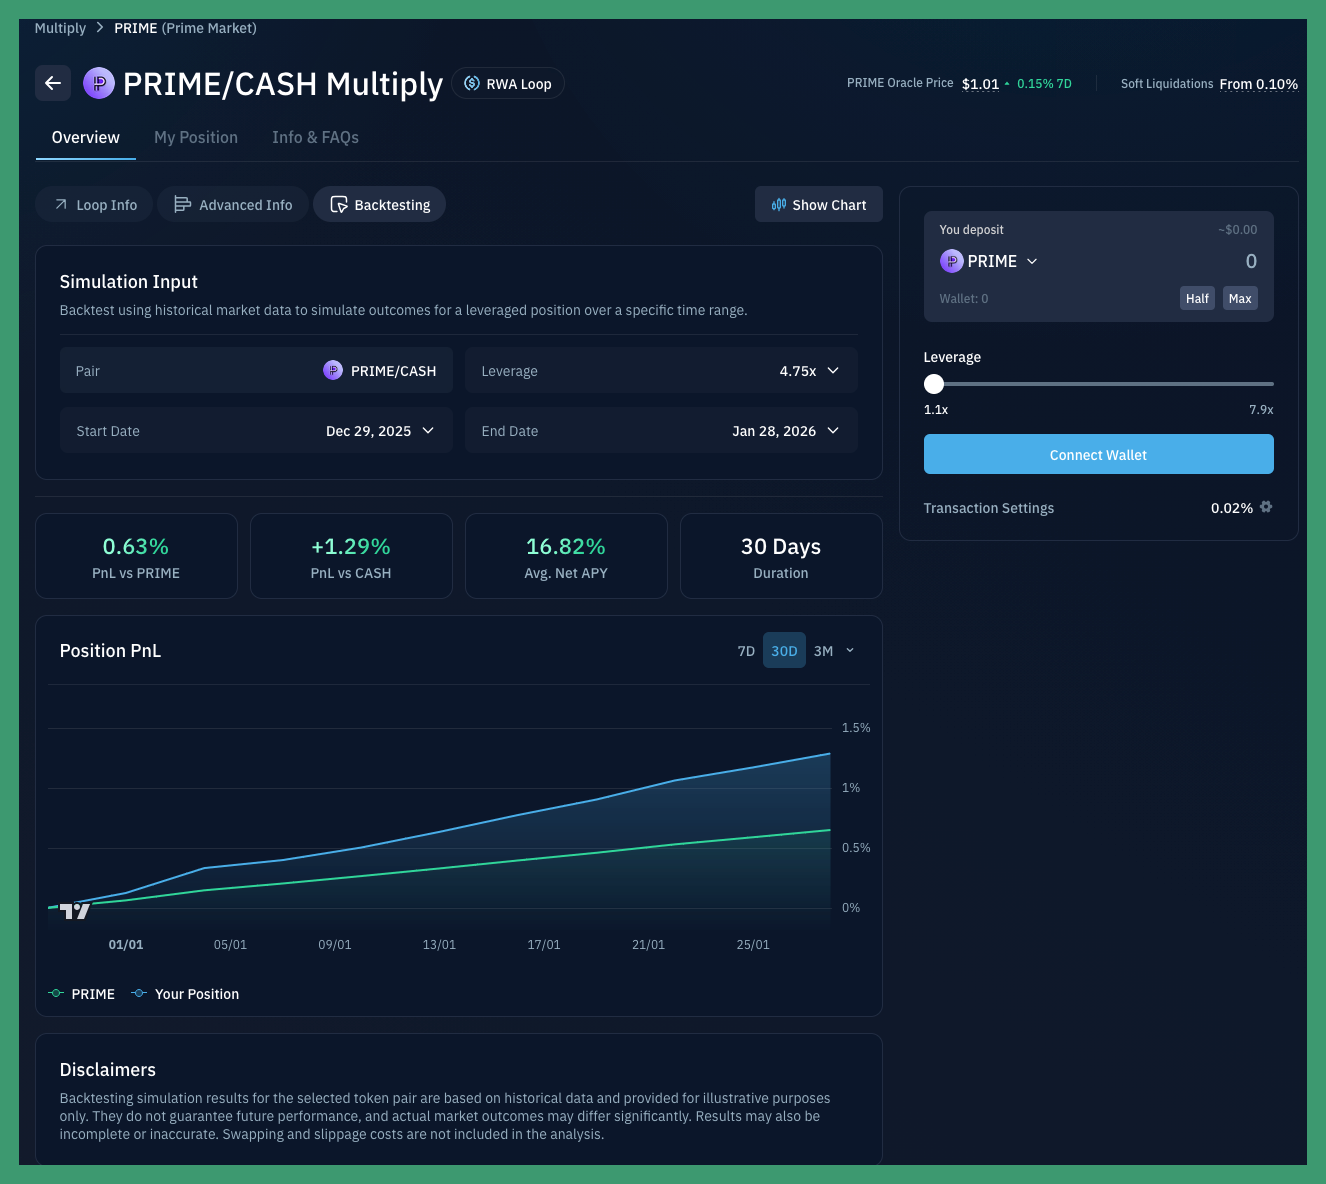
It is worth noting that while the results may be slightly inaccurate due to the exclusion of swapping and slippage costs, the tool remains a valuable resource for contextualizing historical performance. Making good use of this development, we backtested 2133 strategy variants across 33 asset pairs on Multiply over the past 30 days (from the 31st of December to the 29th of January), at every possible leverage tier in increments of 0.1x.
Results
Approximately 86.9% of the potential variations in our dataset were profitable, although only 39.4% achieved a monthly return of 1% or higher. Losses were primarily driven by asset depreciation in directional loops or by borrowing costs outpacing yields at higher leverage multipliers for certain debt tokens.
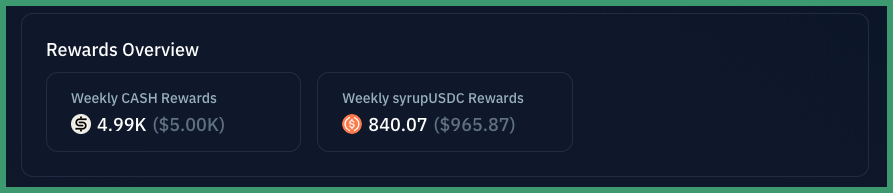
This analysis strictly focuses on base rates, however some Multiply offerings are subject to weekly incentives, which may noticeably influence the final figures and a strategy's viability.
RWAs: The Boring Money
For real-world asset strategies, downside risk is less about asset price volatility and more about infrastructure: smart contracts, oracle dependencies, custodians, and settlement mechanisms. This shift in the risk profile enables RWAs to deliver best-in-class risk-adjusted returns while remaining stable and scaling cleanly with leverage.
Based on our observations, syrupUSDC behaved somewhat differently from other assets in the same category, with 2 out of 5 pairs proving more lucrative than simply holding the base asset.
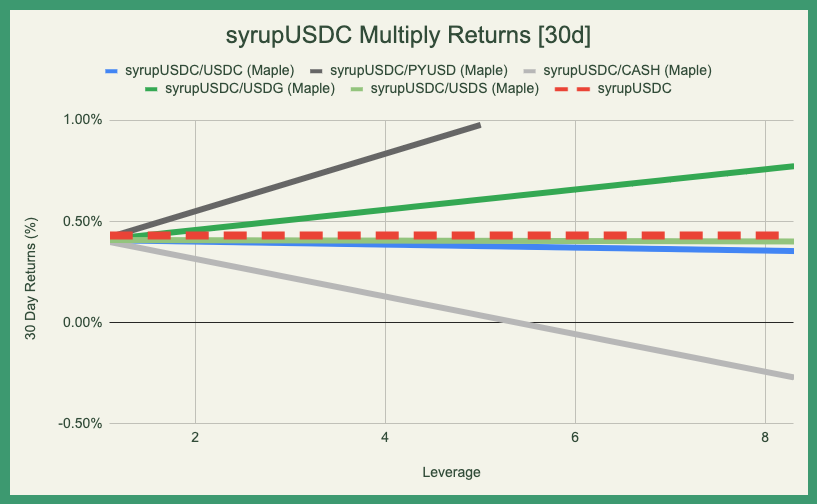
These results highlight the importance of closely tracking underlying market APYs and selecting the appropriate borrow token with sensible leverage, as this can ultimately make or break a strategy. While it may be tempting to treat these positions as passive, periodically rotating between pairs can help avoid diminishing returns or compounding borrowing losses.
PRIME remains the most popular and sought-after asset on the Multiply page, with both of its pairs consistently reaching their caps as soon as liquidity becomes available.
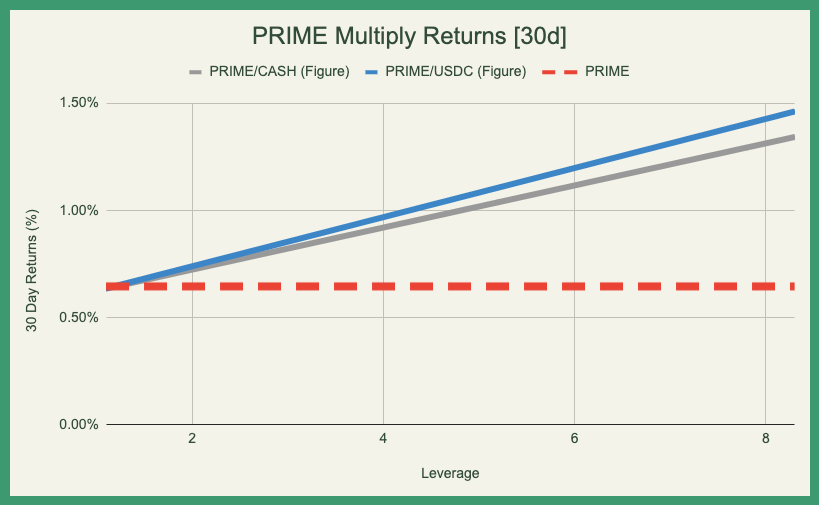
This strong demand is not without reason: PRIME is currently one of the most promising yield-bearing tokens on the market, offering a base yield of 8%, and the interest it has attracted clearly reflects this sentiment. From 4.5x leverage onward, both the USDC and CASH variants begin to outperform other RWAs in our list. We recently covered PRIME in a dedicated article and recommend it to anyone interested in unique structured products.
The final asset in our list, ONyc, despite its relatively small market size of $11.97 million, features the highest native yield, averaging around 9–11%, along with the most attractive leverage-to-return ratio.
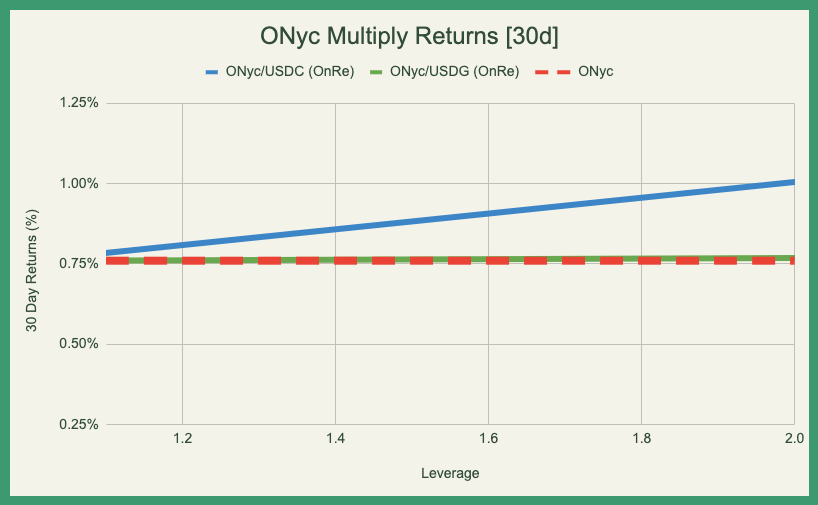
With leverage capped at 2x, the USDC pair is able to generate approximately 12% per annum, while its only counterpart, USDG, barely beats the benchmark due to higher borrowing costs eroding returns.
LSTs: Same but Different
Options for maximizing SOL exposure on Kamino by looping liquid staking tokens are many and varied. Nine pairs on the main market, two more on isolated markets (in our dataset). All nine market pairs stayed profitable at every leverage tier from 1.1x to 7.6x. The trade is simple: deposit an LST that appreciates via staking yield, borrow SOL, pocket the spread.
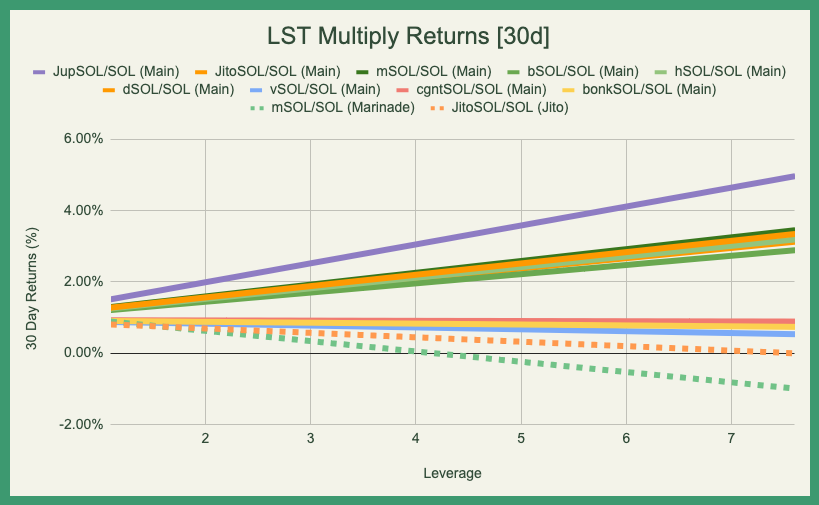
At 1.1x, returns cluster tightly, landing between 0.91% and 1.30%, with nearly identical drawdowns. Hinting at LST choice barely mattering at low leverage. jupSOL is the clear outlier at +1.51%, and the bottom tier (vSOL, nxSOL, bonkSOL, cgntSOL) trails around ~0.89%. The reason is mechanical, since SOL is borrowed at the same rate on the main market, so the yield lives entirely in the token's price appreciation. However the gaps begin to widen as the leverage slider moves more to the east.
The source of this dispersion becomes evident when comparing identical LSTs across different markets. At 1.1x, jitoSOL returns +1.25% on the main market versus +0.81% on Jito’s isolated market, while mSOL posts +1.30% on the main market compared to +0.89% on Marinade. The isolated venues apply higher SOL borrow rates (7.1–7.3% versus 5.48%), and the cost differential compounds linearly. Under these conditions, mSOL on Marinade crosses into negative territory at 4.2x, followed by jitoSOL on Jito at 7.7x.
Conclusion
In a market where spot exposure has become a test of conviction rather than strategy, structured leverage offers a more pragmatic path forward. Our results show that when yield is real, borrowing costs are understood, and leverage is applied deliberately, the odds shift meaningfully in favor of the operator. Leverage is neither a cheat code nor a death wish, it is a multiplier on decision quality. Tools that surface historical performance and cost structures turn what was once opaque into something measurable, and therefore manageable.
Disclaimer
The information provided is for general informational purposes only and does not constitute financial, investment, or legal advice. The content is based on sources believed to be reliable, but its accuracy, completeness, and timeliness cannot be guaranteed. Any reliance you place on the information in this document is at your own risk. On Chain Times may contain forward-looking statements that involve risks and uncertainties. Actual results may differ materially from those expressed or implied in such statements. The authors may or may not own positions in the assets or securities mentioned herein. They reserve the right to buy or sell any asset or security discussed at any time without notice. It is essential to consult with a qualified financial advisor or other professional to understand the risks and suitability of any investment decisions you may make. You are solely responsible for conducting your research and due diligence before making any investment choices. Past performance is not indicative of future results. The authors disclaim any liability for any direct, indirect, or consequential loss or damage arising from the use of this document or its content. By accessing On Chain Times, you agree to the terms of this disclaimer.